Free Preparation Discussions
Free Microsoft PL-300 Exam Dumps July 2026
Here you can find all the free questions related with Microsoft Power BI Data Analyst (PL-300) exam. You can also find on this page links to recently updated premium files with which you can practice for actual Microsoft Power BI Data Analyst Exam. These premium versions are provided as PL-300 exam practice tests, both as desktop software and browser based application, you can use whatever suits your style. Feel free to try the Microsoft Power BI Data Analyst Exam premium files for free, Good luck with your Microsoft Power BI Data Analyst Exam.MultipleChoice
You embed a Power BI report in a Microsoft SharePoint Online page.
A user name User1 can access the SharePoint Online page, but the Power BI web part displays the following error message: ''This content isn't available''.
User1 is unable to view the report.
You verify that you can access the SharePoint Online page and that the Power BI report displays as expected.
You need to ensure that User1 can view the report form SharePoint Online.
What should you do?
OptionsMultipleChoice
You are using the key influencers visual to identify which factors affect the quantity of items sold in an order.
You add the following fields to the Explain By field:
* Customer Country
* Product Category
* Supplier Country
* Sales Employee
* Supplier Name
* Product Name
* Customer City
The key influencers visual returns the results shown in the following exhibit.

What can you identify from the visual?
OptionsOrderList
You publish a dataset that contains data from an on-premises Microsoft SQL Server database.
The dataset must be refreshed daily.
You need to ensure that the Power BI service can connect to the database and refresh the dataset.
Which four actions should you perform in sequence? To answer, move the appropriate actions from the list of actions to the answer area and arrange them in the correct
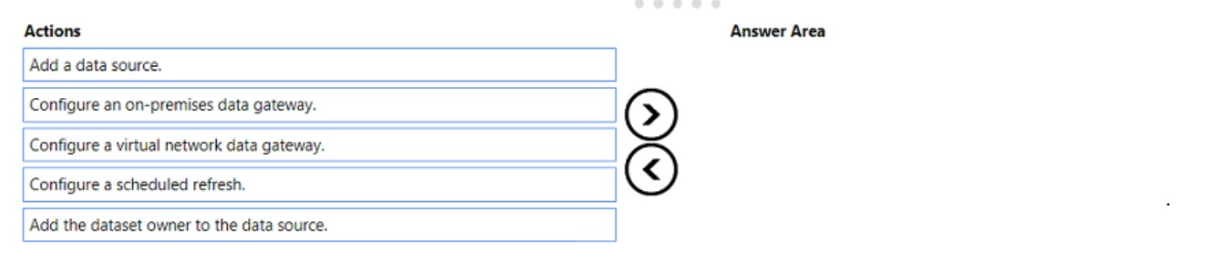
MultipleChoice
Your company has training videos that are published to Microsoft Stream.
You need to surface the videos directly in a Microsoft Power BI dashboard.
Which type of tile should you add?
OptionsMultipleChoice
You are creating a Power BI model that contains a table named Store. Store contains the following fields.
You plan to create a map visual that will show store locations and provide the ability to drill down from Country to State/Province to City. What should you do to ensure that the locations are mapped property?
OptionsOrderList
You have the line chart shown in the exhibit. (Click the Exhibit tab.)

You need to modify the chart to meet the following requirements:
Identify months that have order counts above the mean.
Display the mean monthly order count.
Which three actions should you perform in sequence? To answer, move the appropriate actions from the list of actions to the answer area and arrange them in the correct order.

Hotspot
You are creating a line chart in a Power Bl report as shown in the following exhibit.
Use the drop-down menus to select the answer choice that completes each statement based on the information presented in the graphic.

NOTE: Each correct selection is worth one point.

Hotspot
Your company has affiliates who help the company acquire customers.
You build a report for the affiliate managers at the company to assist them in understanding affiliate performance.
The managers request a visual showing the total sales value of the latest 50 transactions for each affiliate. You have a data model that contains the following tables.

You need to develop a measure to support the visual.
How should you complete the DAX expression? To answer, select the appropriate options in the answer area.
NOTE: Each correct selection is worth one point.

Hotspot
You have a Power B1 model that contains a table named Date. The table has the following columns.

Answer is below.

Hotspot
You have a Power 31 data model that contains a table named Stores. The table has the following columns:
* Store Name
* Open Date
* Status
* State
* City
You need to create a calculated column named Active Store Name that meets the following requirements:
Answer is as below