Deal of The Day! Hurry Up, Grab the Special Discount - Save 25% - Ends In 00:00:00 Coupon code: SAVE25
Free Preparation Discussions
Microsoft AI-900 Exam - Topic 2 Question 34 Discussion
Actual exam question for
Microsoft's
AI-900 exam
Question #: 34
Topic #: 2
[All AI-900 Questions]
Topic #: 2
You have the Predicted vs. True chart shown in the following exhibit.
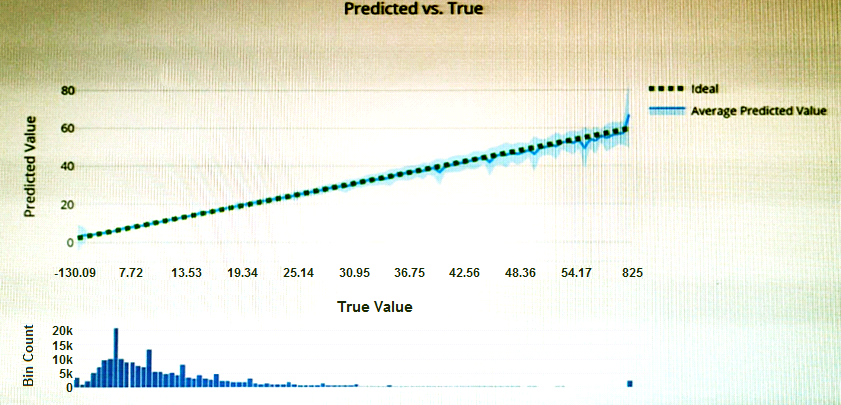
Which type of model is the chart used to evaluate?
Suggested Answer:
B
What is a Predicted vs. True chart?
Predicted vs. True shows the relationship between a predicted value and its correlating true value for a regression problem. This graph can be used to measure performance of a model as the closer to the y=x line the predicted values are, the better the accuracy of a predictive model.
https://docs.microsoft.com/en-us/azure/machine-learning/how-to-understand-automated-m
Raymon
7 months agoSommer
7 months agoJina
7 months agoKenneth
8 months agoJerry
8 months agoRia
8 months agoAnnabelle
8 months agoLizbeth
8 months agoYuki
8 months agoJina
8 months agoKaitlyn
8 months agoJodi
8 months agoMalcom
8 months ago