
Free Preparation Discussions
 MENU
MENU
Juniper JN0-481 Exam - Topic 6 Question 13 Discussion
Topic #: 6
The analytics probe shown in the exhibit is enabled.
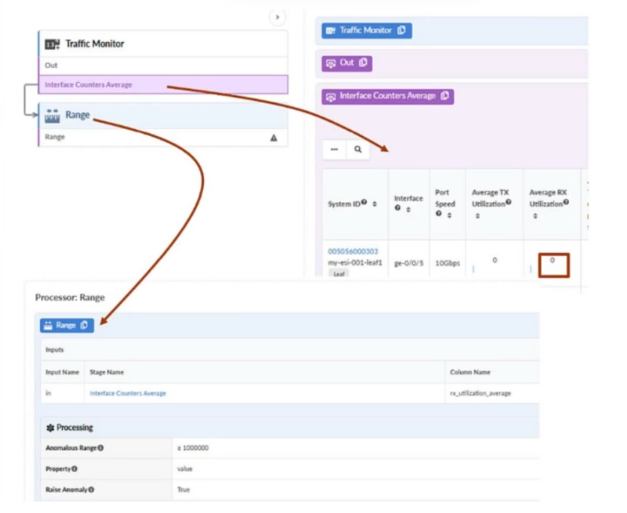
The ge-0/0/5 interface on the my-esl-001-leaf1 node receives an average of greater than 1 Mbps of traffic. Which two statements are correct in this scenario? (Choose two.)
In Apstra 5.1, an IBA probe is a defined analytics pipeline that applies to a scoped set of graph objects (here, interfaces) and evaluates telemetry against logic defined in its processors. The exhibit shows a probe that consumes Interface Counters Average and then applies a Range processor. In the processor configuration, the Anomalous Range is set to ''greater than 1,000,000'' (bytes per second--equivalent for ~1 Mbps depending on the probe's metric definition), and Raise Anomaly is set to True. Therefore, when ge-0/0/5 receives an average traffic level above the configured threshold, the probe's condition evaluates as anomalous and Apstra raises a probe anomaly for that interface. That makes statement A correct.
When probe anomalies are raised, Apstra surfaces them in the blueprint's Analytics area because they are analytics-derived findings (as opposed to configuration drift or deployment workflow issues). As a result, the blueprint's Analytics tab indicator changes state (commonly to red with a badge count) to signal active analytics anomalies requiring attention. That makes statement B correct.
This event is not classified as a service anomaly (which is associated with higher-level service intent/assurance objects) unless separately mapped by policy/logic, and it does not primarily drive the Active tab indicator, which is focused on operational state views rather than being the primary alert surface for IBA probe anomalies.
Dorthy
3 days agoStephen
8 days agoRupert
13 days agoTerina
18 days agoBenton
24 days agoLenora
29 days agoYong
1 month agoRoxanne
1 month agoCarlota
1 month ago