
Free Preparation Discussions
 MENU
MENU
Adobe AD0-E208 Exam - Topic 4 Question 5 Discussion
Topic #: 4
Refer to the exhibit:
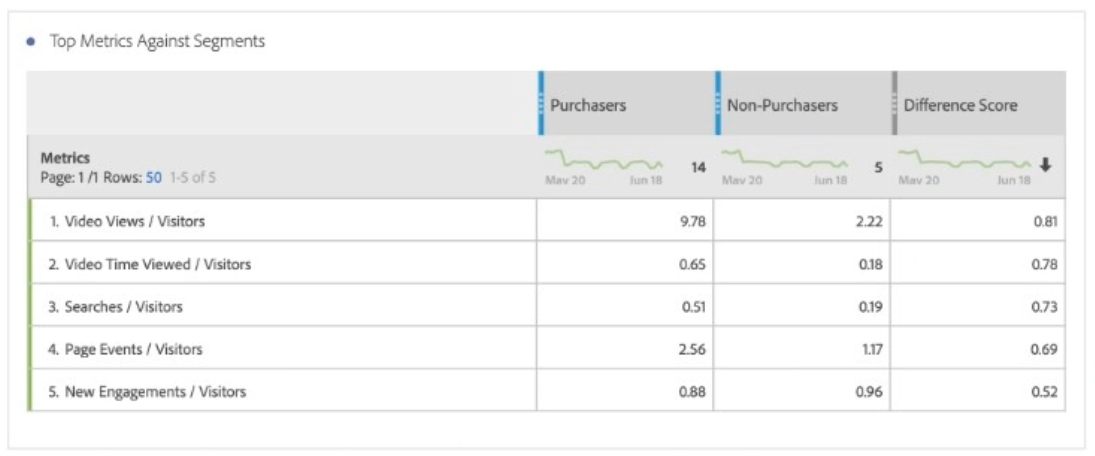
What is a valid interpretation of this Segment Comparison between Purchasers and Non-Purchasers segments?
A valid interpretation of this Segment Comparison between Purchasers and Non-Purchasers segments is that on average, Purchasers view 81 % more videos than Non-Purchasers. This means that the average Video Views per Visitor for Purchasers is 81 % higher than that for Non-Purchasers. Video Views/Visitors is not the most statistically significant difference between the two segments, as it has a low confidence level of 68 %. Purchasers are not 81 % more likely to complete a Video View than Non-Purchasers, as this would imply a probability or conversion rate, not an average.
References: https://experienceleague.adobe.com/docs/analytics/analyze/analysis-workspace/components/segment-comparison.html?lang=en https://experienceleague.adobe.com/docs/analytics/analyze/analysis-workspace/components/segment-comparison.html?lang=en#interpreting-segment-comparison-results
Nakita
10 months agoSusana
11 months agoIdella
11 months agoTerina
11 months agoMelvin
11 months agoPura
11 months agoAimee
11 months agoAdaline
11 months agoPolly
11 months agoBrynn
12 months agoMargot
12 months agoAnissa
12 months agoRodolfo
12 months agoMarleen
12 months ago