Deal of The Day! Hurry Up, Grab the Special Discount - Save 25% - Ends In 00:00:00 Coupon code: SAVE25
Free Preparation Discussions
WGU Applied Algebra Exam - Topic 5 Question 5 Discussion
Actual exam question for
WGU's
Applied Algebra exam
Question #: 5
Topic #: 5
[All Applied Algebra Questions]
Topic #: 5
The graph shows the daily practice duration for a musician, where the number of days since the beginning of the month is along the horizontal axis and the number of minutes practiced per day is along the vertical axis.
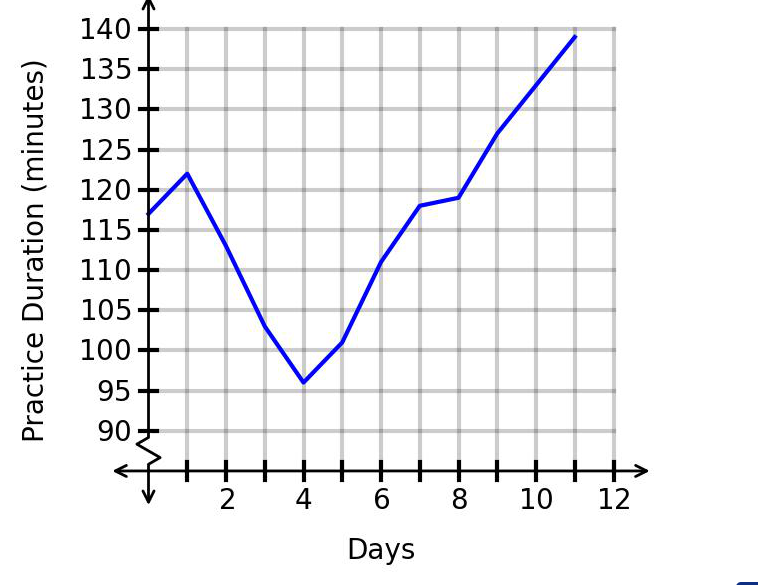
What was the practice duration for day 9, based on the graph?
Suggested Answer:
C
This question asks us to read and interpret a value from a graph.
The horizontal axis represents:
The vertical axis represents:
We need to find the practice duration for:
To do this, locate on the horizontal axis, move upward to the blue graph, and then read the corresponding value on the vertical axis.
From the graph, the point at day is approximately:
So the musician practiced for:
Lawrence
7 hours agoSunny
5 days agoParis
11 days agoCatarina
16 days ago