Free Preparation Discussions
WGU Applied Algebra Exam - Topic 5 Question 3 Discussion
Topic #: 5
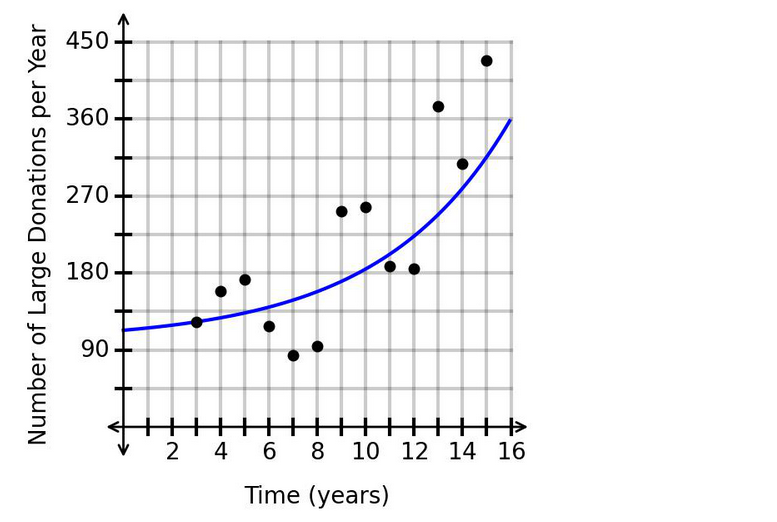
A researcher collected data on the number of large donations per year to a charitable organization. The results are shown in the scatterplot. A regression function is graphed with .
What is the appropriate range of -values for extrapolation?
The scatterplot shows data collected over time, and a regression curve is used to model the pattern.
Extrapolation means using a model to make predictions slightly outside the observed data range. In Applied Algebra, extrapolation can be appropriate when:
and the predicted -values are not too far outside the observed data.
From the scatterplot, the data points appear to run approximately from:
So the observed data range is about:
A reasonable extrapolation range extends a little beyond the data, but not too far. The interval:
extends about 3 units beyond each side of the observed data, which is reasonable.
The interval:
extends much farther beyond the data and would be less reliable.
Also, does not have to equal exactly 1 for extrapolation to be useful. A value less than 1 can still represent a strong model.
Therefore, the correct answer is:
Virgina
7 hours agoPenney
5 days agoCarlton
11 days agoYoko
16 days ago