
 MENU
MENU
The number of new user accounts per day on a website is modeled by a decreasing exponential function. The graph of the function is shown.
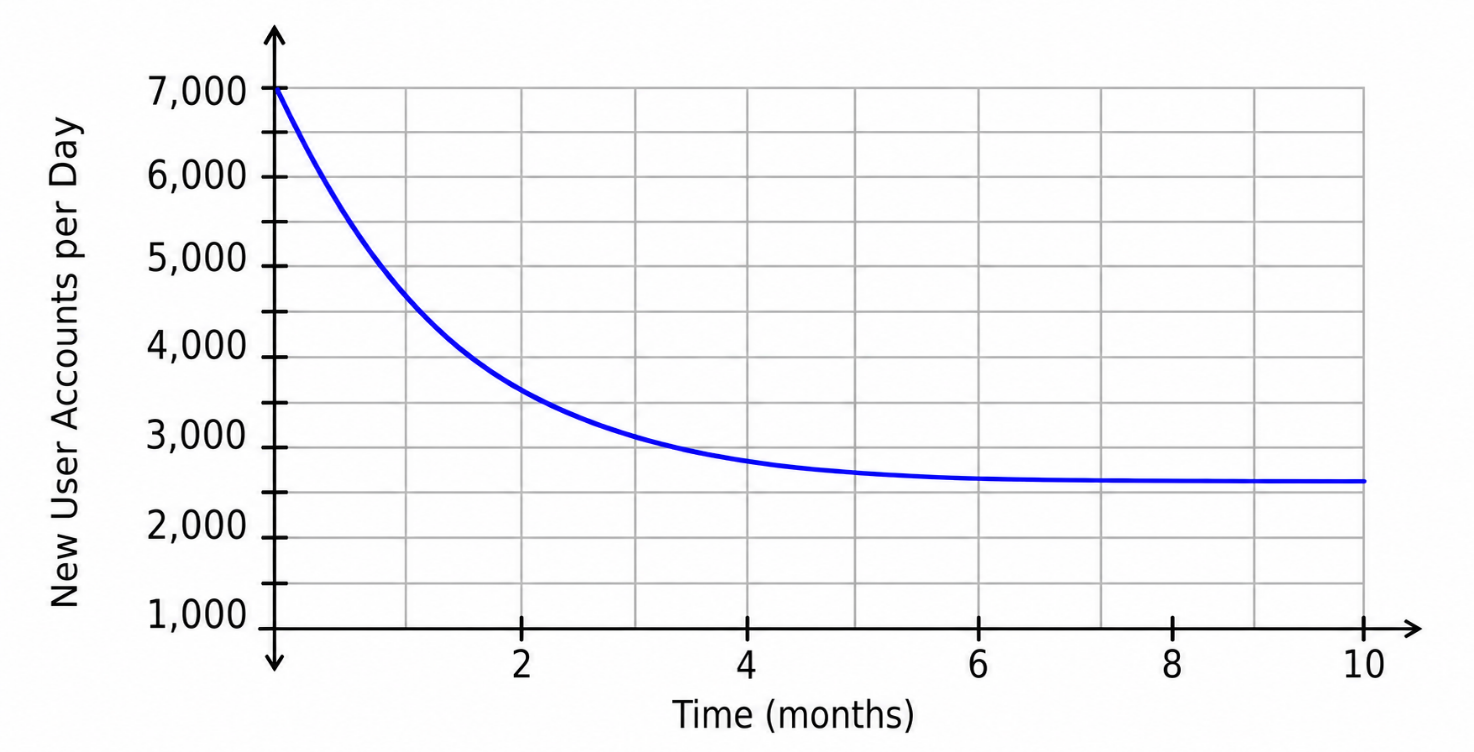
Which statement is justified considering the location of the horizontal asymptote?
The graph shows a decreasing exponential function.
The horizontal axis represents:
The vertical axis represents:
The graph starts near new user accounts per day and decreases over time. However, it does not decrease toward . Instead, the graph levels off near a horizontal value around:
This horizontal value is the horizontal asymptote.
A horizontal asymptote shows the long-term value the function approaches. Since the asymptote is above , the model predicts that the number of daily new user accounts approaches a positive value, not zero.
So the justified statement is: