
 MENU
MENU
The growth of an animal population is shown in the graph. The instantaneous rate of change at point is .
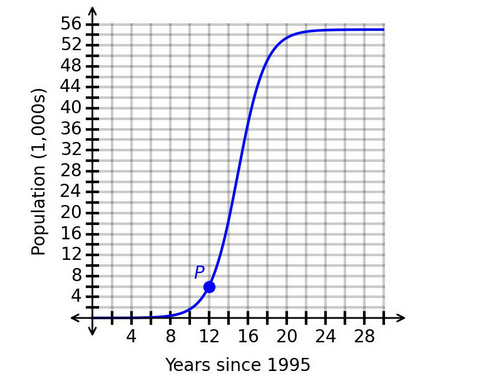
Which interpretation of the instantaneous rate of change is correct?
Suggested Answer: C
Get Premium Applied Algebra (C957) Questions
as Interactive Web-Based Practice Test or PDF
Real Exam Format
Detailed Explanations
Instant Access
Get Your Practice Test
The graph shows population in thousands, and the horizontal axis represents:
Point is located at approximately:
Since represents years since 1995:
So point corresponds to the year:
The instantaneous rate of change at point is:
Because the vertical axis is measured in thousands, this means:
Convert thousands to actual animals:
So in 2007, the population was increasing by approximately:
21 comments · newest first
EL
Elise
2 days ago
I feel like C is a good choice.
CO
Cordelia
7 days ago
A seems too low for 2012.
RO
Ronald
12 days ago
No way, it's B!
JU
Juliann
17 days ago
I think it's A.
AL
Alisha
23 days ago
B is unrealistic. 3,740 is too much.
TA
Tawny
28 days ago
A is clear. It matches the graph.
PI
Pilar
1 month ago
D seems off. The year is wrong.
JO
Jordan
1 month ago
What about D? It mentions 2007.
GL
Glenna
1 month ago
I agree with Alex. A is the best choice.
WH
Whitley
2 months ago
A makes sense. 3.74 sounds right.
WE
Weldon
2 months ago
I feel like B is too high.
ST
Stephane
2 months ago
I think it's A. The graph shows 2012.
AN
Annelle
2 months ago
D sounds right, but I lean towards A.
PH
Phyliss
2 months ago
Wait, are we sure about the year? Feels like a trick question.
DA
Daryl
2 months ago
C seems off too, wasn't it about 2012?
VE
Vernice
3 months ago
Definitely not B, that's way too high!
WI
Wilbert
3 months ago
I think it's A, 3.74 animals per year.
SA
Sang
3 months ago
I think we discussed that the instantaneous rate of change gives us the population growth at a specific year, but I can't recall which option matches that correctly.
AF
Afton
3 months ago
I feel like the rate of change should be in the same units as the population, so I’m leaning towards the smaller number, but I can't remember if it was 3.74 or 3,740.
SH
Shizue
3 months ago
I’m not entirely sure if the year is 2012 or 2007 for the rate of change. I think we had a similar question in practice where the year was crucial.
MA
Malinda
4 months ago
I remember we talked about how the instantaneous rate of change relates to the slope of the tangent line at a specific point on the graph.