Free Preparation Discussions
 MENU
MENU
Free WGU Applied Algebra (C957) Exam Dumps October 2026
Here you can find all the free questions related with WGU Applied Algebra (Applied Algebra (C957)) exam. You can also find on this page links to recently updated premium files with which you can practice for actual WGU Applied Algebra Exam. These premium versions are provided as Applied Algebra (C957) exam practice tests, both as desktop software and browser based application, you can use whatever suits your style. Feel free to try the WGU Applied Algebra Exam premium files for free, Good luck with your WGU Applied Algebra Exam.MultipleChoice
Based on collected data, the number of registered voters in a district can be modeled using the function
whose graph is shown, where represents the number of years since 2001 and represents the number of registered voters.
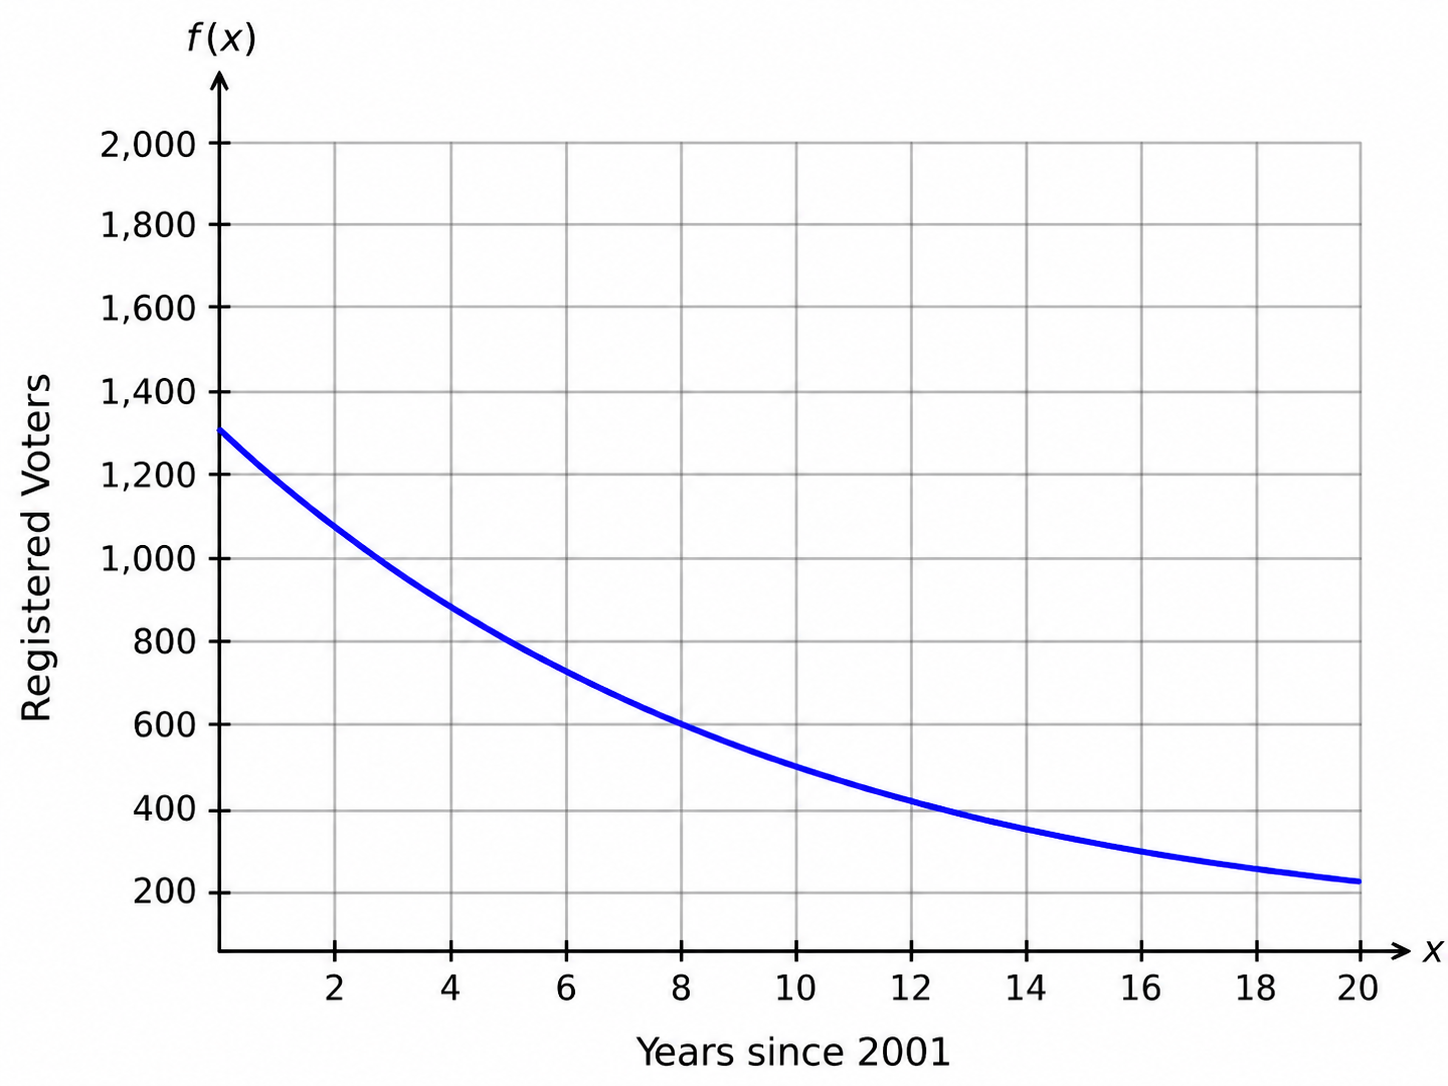
Which time period has the fastest average decrease in the number of registered voters?
OptionsMultipleChoice
The number of wild horses in a federal park is represented by the logistic function , whose graph is shown, where represents the number of years since the park was established and represents the wild horse population in a given year.
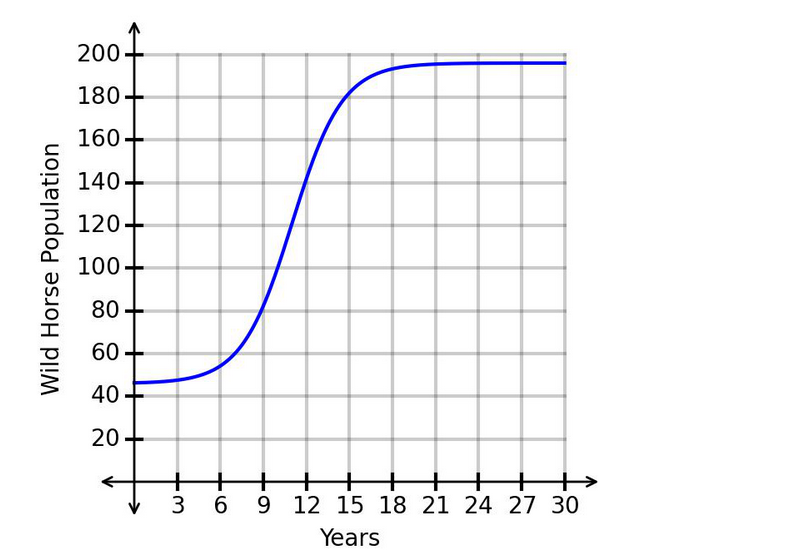
How does the number of wild horses change as time progresses from year 1 to year 9?
OptionsMultipleChoice
The number of daily raffle tickets sold, , for a fundraiser is represented by the graph, with the number of days since the beginning of the month along the horizontal axis and the number of raffle tickets sold for the day along the vertical axis.
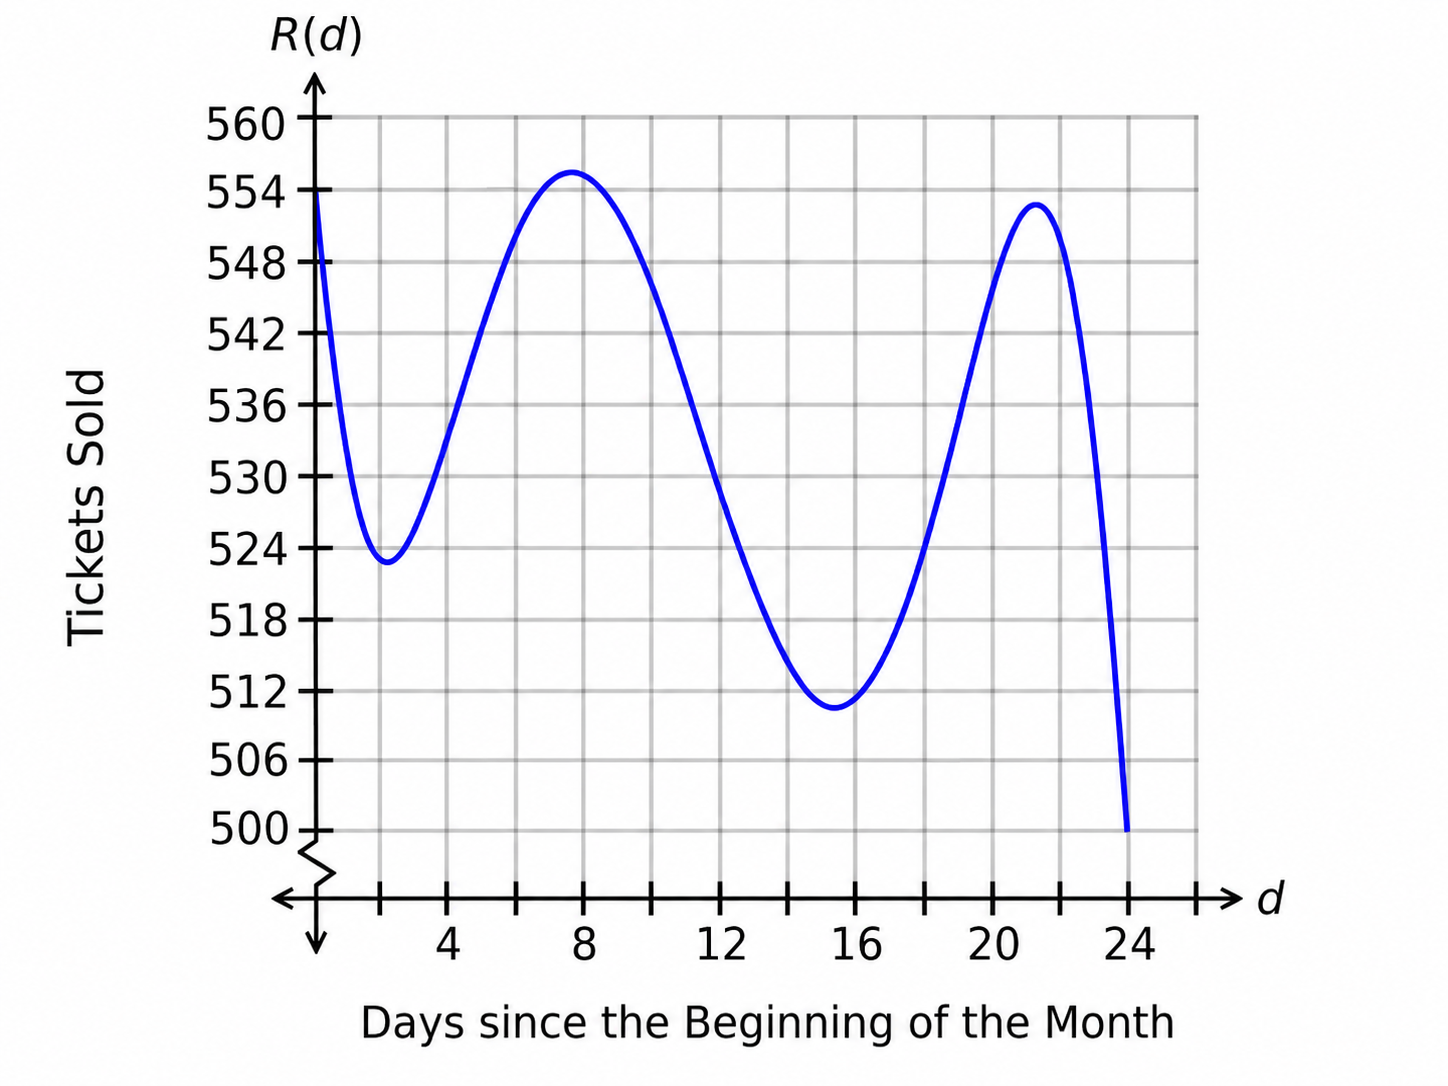
How can the concavity be described from to ?
Options