New Year Sale 2026! Hurry Up, Grab the Special Discount - Save 25% - Ends In 00:00:00 Coupon code: SAVE25
Free Preparation Discussions
Free Salesforce Plat-101 Exam Dumps
Here you can find all the free questions related with Salesforce Certified Platform Foundations (Plat-101) exam. You can also find on this page links to recently updated premium files with which you can practice for actual Salesforce Certified Platform Foundations Exam. These premium versions are provided as Plat-101 exam practice tests, both as desktop software and browser based application, you can use whatever suits your style. Feel free to try the Salesforce Certified Platform Foundations Exam premium files for free, Good luck with your Salesforce Certified Platform Foundations Exam.Question No: 1
MultipleChoice
Refer to the screenshot that shows the top portion of the Salesforce Service app with areas labeled A, B, and C.
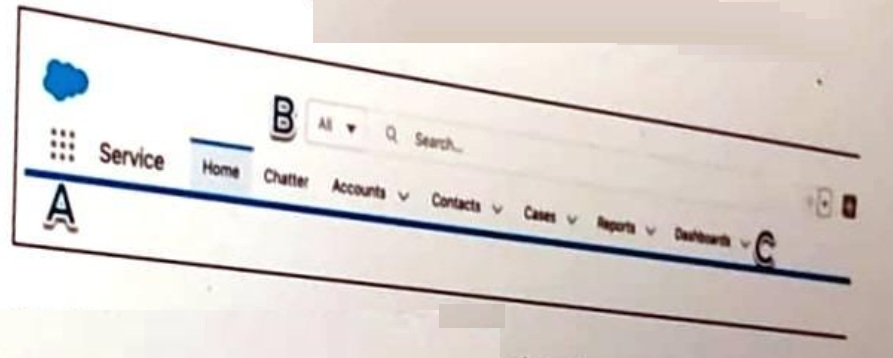
Get Cloudy Consulting (GCC) offers sales and services consoles to meet the various needs of its end users?
Where should GCC' end users go to change to the Sales Console.
OptionsQuestion No: 2
MultipleChoice
A Salesforce associate is creating a report that needs to show changes uin a value over a series of point in time.
Which type of chart should the associate add to this report to help visualize these changes?
Options