
 MENU

You have the following box plot that shows the distribution of average profits made in every state by region.
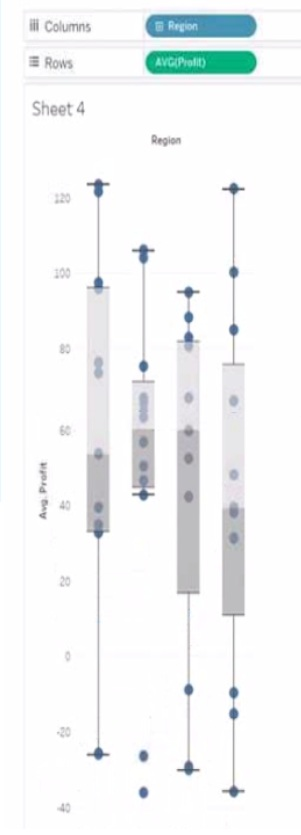
Which region has the smallest distribution of profits?
Suggested Answer: A
Get Premium Analytics-DA-201 Questions
as Interactive Web-Based Practice Test or PDF
Real Exam Format
Detailed Explanations
Instant Access
Get Your Practice Test
The box plot visualization displays the distribution of average profits by region. The distribution of profits is represented by the range of the box (interquartile range) and the whiskers (which often represent the total range excluding outliers). From the image provided, the South region has the smallest visible range within its box and the shortest whiskers, indicating the smallest distribution of average profits among the choices provided.
1 comments · newest first
TE
Tegan
3 hours ago
I think the region with the smallest distribution of profits might be the Central region, but I'm not entirely sure.