
Free Preparation Discussions
 MENU
MENU
Salesforce Analytics-Con-301 Exam - Topic 2 Question 20 Discussion
Topic #: 2
A Tableau consultant tasked with evaluating a data structure is handed the below sample dataset.
Which two statements are true about the dataset? Choose two.
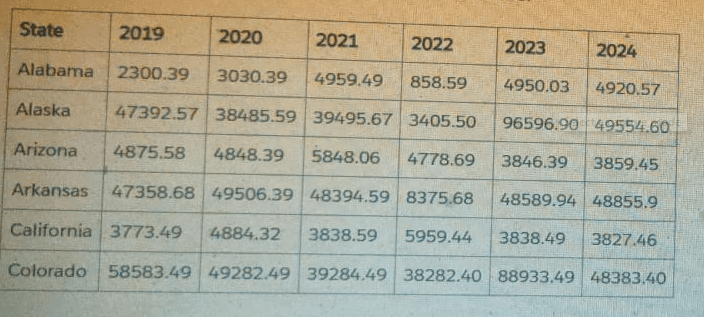
The dataset shown is a classic ''wide'' format'':
A single row per state
Separate columns for each year: 2019, 2020, 2021, 2022, 2023, 2024
Tableau's documentation on data structure and pivoting explains:
Why A is TRUE
Tableau documentation identifies wide datasets (multiple columns representing categories such as years, months, or similar time periods) as high-maintenance structures because:
For every new year, a new column must be added.
Metadata and calculations must be updated each time.
This type of structure is described as having poor scalability and higher maintenance.
This dataset fits that exact description, so A is correct.
Why C is TRUE
According to Tableau's ''Pivot Data from Columns to Rows'' section:
Wide datasets can and should often be pivoted so that repeated columns (such as year columns) become rows.
Pivoting enables dynamic capabilities such as:
Year filters (year selector)
Time-series analysis
Consistent aggregations
Simplified calculations
Pivoting this dataset would produce:
State
Year
Value
Alabama
2019
2300.39
Alabama
2020
3030.39
...
...
...
This makes the dataset tall and tidy, which Tableau identifies as better for analysis and dashboard interactivity.
Therefore, C is correct.
Why B is FALSE
The column names (2019, 2020, 2021...) are simply numbers.
Tableau documentation stresses that good metadata includes descriptive column names.
These column names:
Do not indicate what the measure represents (Revenue? Sales? Population?)
Only show the year, not the meaning of the metric
Thus they are not considered accurate or descriptive column names.
Why D is FALSE
The dataset is already denormalized, not normalized.
Denormalized data means combining multiple attributes (like multiple years) into one table, which is exactly what this dataset already does.
Tableau documentation explains that wide data is already denormalized, and the recommended fix is pivoting, not further denormalization.
Therefore, D is incorrect.
Tijuana
3 days agoAleisha
8 days agoMozell
13 days agoNoble
18 days agoLucina
23 days ago