Free Preparation Discussions
Salesforce Analytics-Con-301 Exam Questions
- Topic 1: Business Analysis: This section of the exam measures skills of Tableau Consultants focusing on evaluating the current state of analytics within an organization. It covers mapping business needs to Tableau capabilities, translating analytical requirements to best practices in Tableau, and recommending appropriate deployment options like Tableau Server or Tableau Cloud. It also includes evaluating existing data structures for supporting business needs and identifying performance risks and opportunities.
- Topic 2: Data Analysis: This domain targets Tableau Consultants to plan and prepare data connections effectively. It includes recommending data transformation strategies, designing row-level security (RLS) data structures, and implementing advanced data connections such as Web Data Connectors and Tableau Bridge. Skills in specifying granularity and aggregation strategies for data sources across Tableau products are emphasized.
- Topic 3: Business Consulting: For Tableau Consultants, this section involves designing and troubleshooting calculations and workbooks to meet advanced analytical use cases. It covers selecting appropriate chart types, applying Tableau’s order of operations in calculations, building interactivity into dashboards, and optimizing workbook performance by resolving resource-intensive queries and other design-related issues.
- Topic 4: Data Management: This part focuses on establishing governance and support for published content. Tableau Consultants are expected to manage data security, publish and maintain data sources and workbooks, and oversee content access. It includes applying governance best practices, using metadata APIs, and supporting administration functions to maintain data integrity and accessibility.
- Topic 5: Data Visualization: This section evaluates the Tableau Consultant’s ability to design effective visual analytics solutions. It involves creating dashboards and visual reports that enhance user understanding, employing techniques like dynamic actions and advanced chart types, and ensuring performance optimization for an interactive user experience.
- Topic 6: IT Management: This domain measures skills related to managing Tableau environments. It includes planning server upgrades, recommending deployment solutions (on-premise or cloud), and ensuring alignment between technical and business requirements for analytics infrastructure. It also involves troubleshooting and optimizing system performance relevant to Tableau Server and Cloud deployments.
Free Salesforce Analytics-Con-301 Exam Actual Questions
Note: Premium Questions for Analytics-Con-301 were last updated On Jul. 20, 2026 (see below)
A client's fiscal calendar runs from February 1 through January 31.
How should the consultant configure Tableau to use the client's fiscal calendar when building date charts?
Comprehensive and Detailed Explanation From Exact Extract:
Tableau allows fiscal calendars to be defined at the data source level, affecting how all date fields behave across the workbook.
According to Tableau documentation:
Fiscal calendars must be set using Data Source Date Properties.
Once set, this becomes a default property for all date fields unless overridden.
This allows charts, hierarchies, and date parts to automatically follow the fiscal year starting in February.
Correct procedure:
Go to Data Source.
Open Date Properties.
Set Fiscal Year Start = February.
(Optional) Adjust Date Field Default Properties.
This ensures all charts and date hierarchies use the fiscal calendar automatically.
Why the other options are incorrect:
A . Right-click on axis Use Fiscal Calendar
This option does not exist in Tableau.
B . Set Fiscal Year in Data Preview
Not supported; fiscal configuration isn't made in the preview window.
C . Use FISCALYEAR() / FISCALQUARTER()
This is manual, requires custom fields, and does not configure Tableau's built-in fiscal calendar system.
This is more work and not the correct method.
Only Option D configures the fiscal calendar globally and correctly.
Tableau Date Properties documentation specifying fiscal year settings.
Default Properties configuration for date fields.
Official guidance for implementing fiscal calendars.
A client has a published dashboard. They change the dashboard and then republish it. Now, users report that their web browser bookmarks to the dashboard
are broken.
What are two possible causes for this issue? Choose two.
When a client republishes a dashboard after making changes and users report broken bookmarks, the likely causes include:
The dashboard was published to a different project: Changing the project location alters the URL path, causing bookmarks to point to a now non-existent dashboard location.
The dashboard was published with a new name: Altering the dashboard's name changes its URL, resulting in broken bookmarks as the previous URL no longer leads to the intended dashboard.
A data analyst sets up a calculation to filter a dashboard so that it displays only the users' information. The dashboard will then be published to Tableau Cloud.
The data analyst plans to use the following calculation to filter the data: USERNAME() = [Correct Answer]
Which column in the table below should the data analyst reference in the calculation?
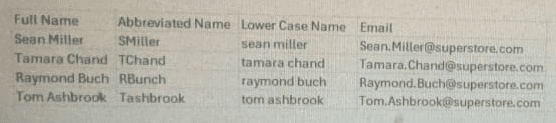
When dashboards are published to Tableau Cloud, the function USERNAME() returns the user's Tableau Cloud username, which is the email address associated with their Tableau Cloud account.
Tableau documentation states:
On Tableau Cloud, the value returned by USERNAME() is always the user's email address.
Row-Level Security (RLS) is typically implemented using a comparison of USERNAME() to an email field in the data source.
For secure filtering, the field compared to USERNAME() must match the authentication identity exactly.
Looking at the provided table:
''Abbreviated Name'' contains short custom codes like ''SMiller,'' which do not match Tableau Cloud usernames.
''Lower Case Name'' contains names like ''sean miller,'' which also do not match Tableau Cloud usernames.
''Email'' contains the full email address for each user, such as ''Sean.Miller@superstore.com,'' which is the only field that corresponds to what USERNAME() returns in Tableau Cloud.
Therefore, the correct field to reference is Email.
Tableau Cloud authentication documentation stating USERNAME() returns the user's email address.
Row-Level Security setup guidance recommending the comparison USERNAME() = [Email Field].
Tableau security practices indicating only the email column will match USERNAME() values on Tableau Cloud.
A company uses an extract built from Custom SQL joining Claims and Members.
Members have multiple records in both tables causing data duplication, which results in inflated claim cost trends.
Which approach meets performance and maintenance goals?
Comprehensive and Detailed Explanation From Exact Extract:
The problem:
Custom SQL joins two multi-row tables, causing many-to-many duplication.
This artificially multiplies claim costs.
The extract becomes heavy and slow due to Custom SQL.
Tableau's recommended solution:
Use Relationships in the Logical Layer
Instead of physical joins
Tableau resolves many-to-many issues automatically
Query is generated at the appropriate granularity to avoid duplication
This is exactly Option A.
Relationships allow the Claims facts to remain at the claim grain and Members to remain at the member grain. Tableau resolves aggregations correctly, preventing inflated values.
Why the others are incorrect:
B --- Physical Join
Would continue the same duplication problem because multi-row joins multiply rows.
C --- LODs
Would require complex calculations and are error-prone.
They do NOT fix the duplication in the underlying extract.
D --- Table Calculations
Happen after Tableau aggregates the duplicated data --- too late to fix the inflated baseline numbers.
Thus, the only correct and modern solution is relationships.
Relationships documentation explaining resolution of many-to-many granularity issues.
Guidance recommending avoiding Custom SQL for performance reasons.
Logical Layer behavior preventing row-duplication errors.
A consultant is creating a dashboard to report on hourly sales data. The data should be refreshed hourly and is used for timely decision-making, so it is important to alert dashboard viewers when data has not been refreshed.
Which feature of Tableau Catalog should the consultant use to ensure dashboard viewers understand this message?
Comprehensive and Detailed Explanation From Exact Extract:
Tableau Catalog provides multiple features for communicating data quality and freshness.
Data Quality Warnings (DQWs) are part of Catalog's metadata management system and are specifically designed to inform users about data issues, including when data is stale.
There are two visibility levels:
1. Standard Visibility Data Quality Warning
Appears subtly in metadata panels.
Intended for non-critical issues.
Does not guarantee the message will be seen by dashboard viewers.
2. High Visibility Data Quality Warning
Designed for urgent, critical, and highly visible alerts.
Displays a prominent warning indicator directly on connected dashboards, data sources, and workbooks.
Tableau documentation states high-visibility warnings are used when users must be alerted, such as:
Stale data
Incomplete refreshes
Data outages
Because the question emphasizes:
''important to alert dashboard viewers when data has not been refreshed''
A standard warning is not strong enough, but a High Visibility Data Quality Warning is explicitly designed for this scenario.
Evaluation of the choices:
A . Standard Visibility Data Quality Warning --- Not sufficient
It does not force dashboard users to notice the warning.
B . High Visibility Data Quality Warning --- Correct
This option is specifically meant to notify users of critical freshness issues, making it the perfect match for the requirement.
C . Certified Data Source --- Incorrect
Certification communicates trustworthiness, not freshness or alerts.
D . Lineage --- Incorrect
Lineage shows data relationships and dependencies, not refresh warnings.
Conclusion
To alert viewers about stale data in hourly-refreshed dashboards, the consultant must use a High Visibility Data Quality Warning.
Reference From Tableau Catalog Documentation
Description of Data Quality Warnings and their visibility levels.
Definition of High Visibility DQWs as critical alerts shown to dashboard viewers.
Catalog guidelines for stale data detection and communication.
- Select Question Types you want
- Set your Desired Pass Percentage
- Allocate Time (Hours : Minutes)
- Create Multiple Practice tests with Limited Questions
- Customer Support
William Baker
5 days agoMargaret Rogers
11 days agoMaria Scott
1 month agoGary Harris
1 month agoHarold Nguyen
2 months agoRebecca Perez
2 months agoJoseph Campbell
3 months agoPaul Edwards
3 months agoStephanie Flores
3 months agoFrank Thomas
3 months agoBrian Carter
2 months agoKimberly Peterson
3 months agoLoreta
4 months agoAndra
4 months agoMarlon
4 months agoKrissy
4 months agoLaurel
5 months agoChristiane
5 months agoRaylene
5 months agoSabine
5 months agoKenia
6 months agoFrancesco
6 months agoReiko
6 months agoJudy
6 months agoVirgina
7 months agoVi
7 months agoTasia
7 months agoBelen
7 months agoKami
8 months agoIsabelle
8 months agoJames
8 months agoDenny
8 months agoMila
9 months agoKattie
9 months agoGilma
9 months agoLaurene
9 months agoCyril
10 months agoSage
10 months agoLennie
10 months agoErasmo
10 months agoJoseph
10 months agoKing
11 months agoIvette
11 months agoVallie
11 months ago