
 MENU

When troubleshooting an issue at a site that is running on two cellular links from two carriers, the operations team shared some evidence shown in the graph below:
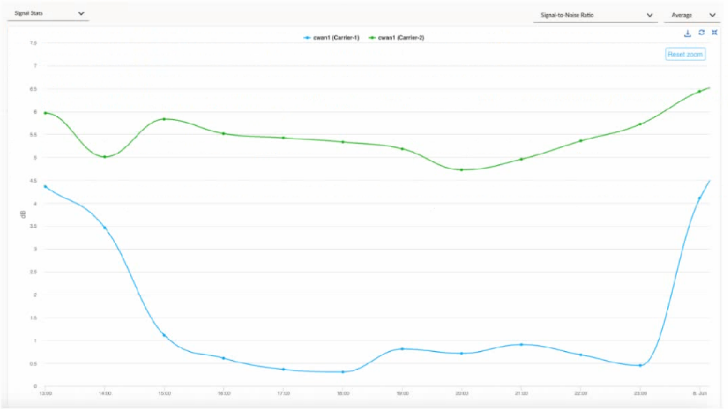
For the time duration shown in the graph, what are two inferences about the site's traffic that can be made? (Choose two.)
The provided graph displays the Signal-to-Noise Ratio (SNR) for two cellular carriers, Carrier-1 (blue line) and Carrier-2 (green line), over a specific period. In cellular communications, SNR is a critical metric used to determine the quality of a wireless signal. A higher SNR indicates a cleaner, stronger signal, while a lower SNR indicates that the signal is being 'drowned out' by background noise or interference, which directly correlates to performance degradation, packet loss, and lower throughput.
Looking at the graph, Carrier-1 experiences a significant and sustained drop in SNR, falling from roughly 4.5 dB to nearly 0.5 dB for the majority of the time duration. This drastic reduction in signal quality strongly suggests that Carrier-1 may have experienced performance degradation (Option A). During this dip, the link quality would likely fall below the configured thresholds for business-critical application traffic.
Because Prisma SD-WAN is an application-defined fabric that continuously monitors path health, the ION device would detect this degradation on Carrier-1. If Carrier-2 maintains a significantly higher and more stable SNR (as shown by the green line remaining between 4.5 dB and 6.5 dB), the ION device's Path Selection engine would automatically steer traffic away from the degraded link. Consequently, it is highly probable that Carrier-1 traffic switched over to Carrier-2 (Option D) to maintain the application SLA. This automated failover is a core strength of the Prisma SD-WAN architecture, ensuring that the best available path is utilized based on real-time link statistics rather than simple 'up/down' states.
Currently there are no comments in this discussion, be the first to comment!