Free Preparation Discussions
Microsoft 70-778 Exam Questions
Free Microsoft 70-778 Exam Actual Questions
Note: Premium Questions for 70-778 were last updated On 01-01-1970 (see below)
Note: This question is part of a series of questions that present the same scenario. Each question in the series contains a unique solution that might meet the stated goals. Some question sets might have more than one correct solution, while others might not have a correct solution.
After you answer a question in this section, you will NOT be able to return to it. As a result, these questions will not appear in the review screen.
You have a Power BI model that contains two tables named Sales and Date. Sales contains four columns named TotalCost, DueDate, ShipDate, and OrderDate. Date contains one column named Date.
The tables have the following relationships:
Sales[DueDate] and Date[Date]
Sales[ShipDate] and Date[Date]
Sales[OrderDate] and Date[Date]
The active relationship is on Sales[DueDate].
You need to create measures to count the number of orders by [ShipDate] and the orders by [OrderDate]. You must meet the goal without duplicating data or loading additional data.
Solution: You create measures that use the CALCULATE, COUNT, and USERELATIONSHIP DAX functions.
Does this meet the goal?
References:
https://docs.microsoft.com/en-us/dax/calculate-function-dax
https://docs.microsoft.com/en-us/dax/count-function-dax
https://docs.microsoft.com/en-us/dax/userelationship-function-dax
Your organization has a team of power users who recently created 20 Power BI dashboards.
The power users share the dashboards with other users in the organization.
When the users attempt to access the dashboards, they receive the error message shown in the exhibit. (Click the Exhibit.)
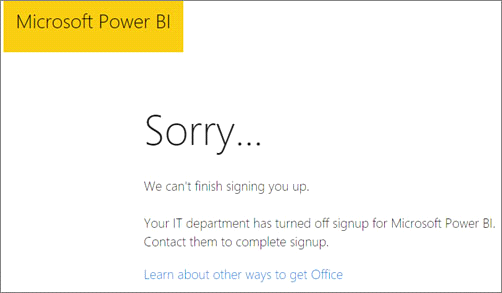
You need to ensure that all the users can access the dashboards.
What should you do first?
References:
http://www.nubo.eu/en/blog/2016/12/Enable-PowerBI-On-Office-365/
In the Power BI service, you create an app workplace that contains several dashboards.
You need to provide a user named user1@contoso.com with the ability to edit and publish dashboards.
What should you do?
You manage a Power BI model has a table named Sales and product.
You need to ensure that a sales team can view only data that has a CountryRegionName value of United States and a ProductCategory value of Clothing.
What should you do from Power BI Desktop?
References:
https://docs.microsoft.com/en-us/power-bi/power-bi-how-to-report-filter
Note: This question is a part of a series of questions that present the same scenario. For your convenience, the scenario is repeated in each question. Each question presents a different goal and answer choices, but the text of the scenario is exactly the same in each question in this series.
Start of repeated scenario
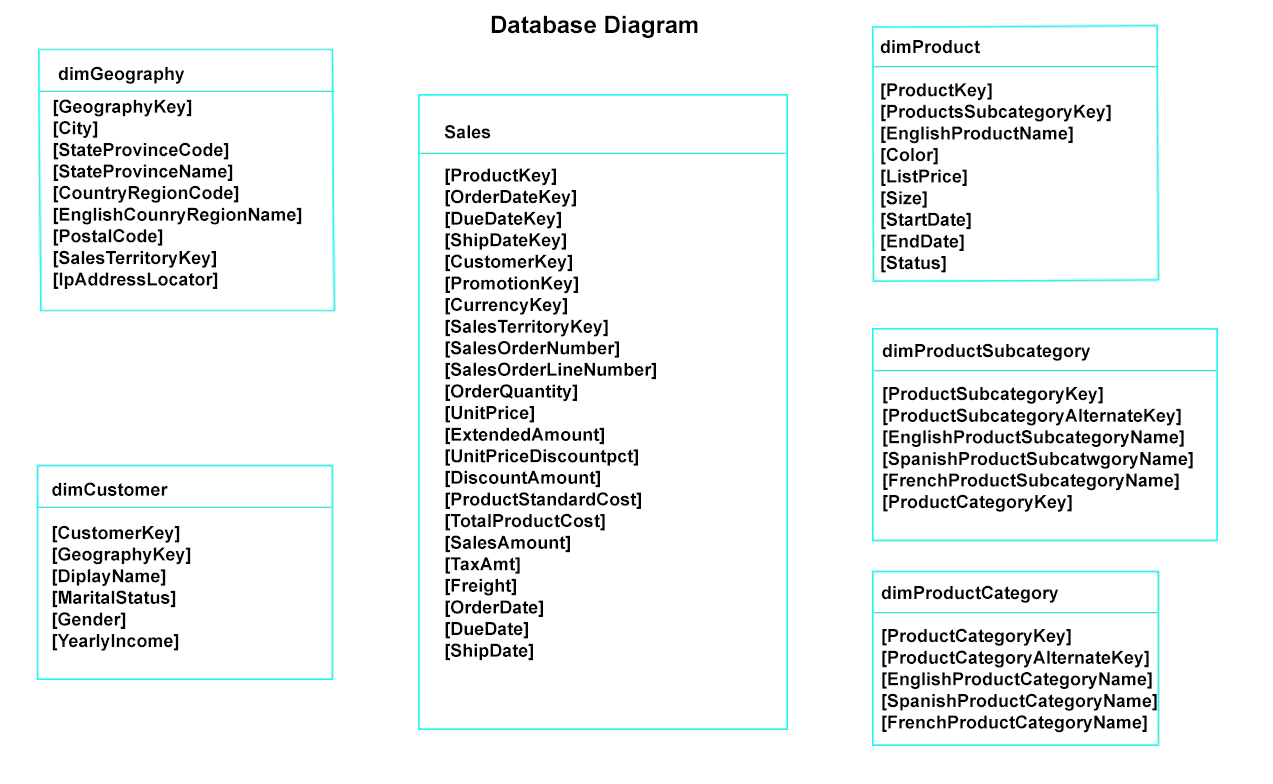
You have a Microsoft SQL Server database that has the tables shown in the Database Diagram exhibit. (Click the Exhibit.)
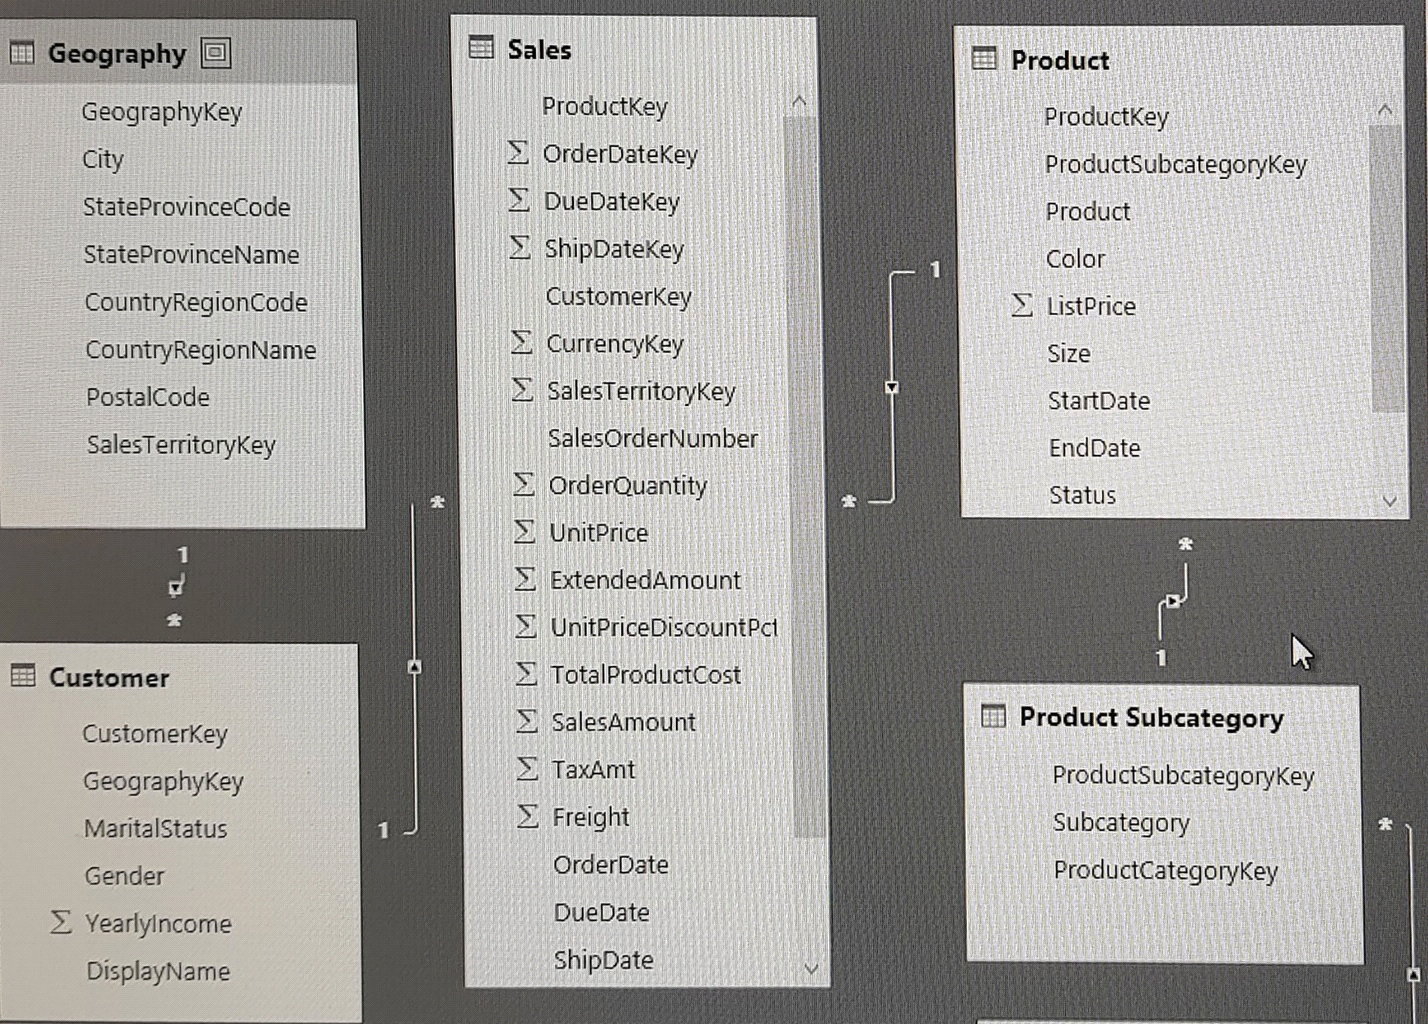
You plan to develop a Power BI model as shown in the Power BI Model exhibit. (Click the Exhibit).
You plan to use Power BI to import data from 2013 to 2015.
Product Subcategory [Subcategory] contains NULL values.
End of repeated scenario.
You implement the Power BI model.
You need to add a measure to rank total sales by product. The results must appear as shown in the following table.
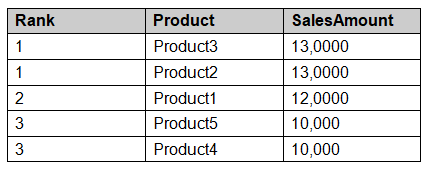
Which DAX formula should you use?
References:
https://msdn.microsoft.com/en-us/library/gg492185.aspx
- Select Question Types you want
- Set your Desired Pass Percentage
- Allocate Time (Hours : Minutes)
- Create Multiple Practice tests with Limited Questions
- Customer Support
Currently there are no comments in this discussion, be the first to comment!