Deal of The Day! Hurry Up, Grab the Special Discount - Save 25% - Ends In 00:00:00 Coupon code: SAVE25
Free Preparation Discussions
Microsoft Exam DA-100 Topic 12 Question 50 Discussion
Actual exam question for
Microsoft's
DA-100 exam
Question #: 50
Topic #: 12
[All DA-100 Questions]
Topic #: 12
You have the visual shown in the Original exhibit. {Click the Original tab.)
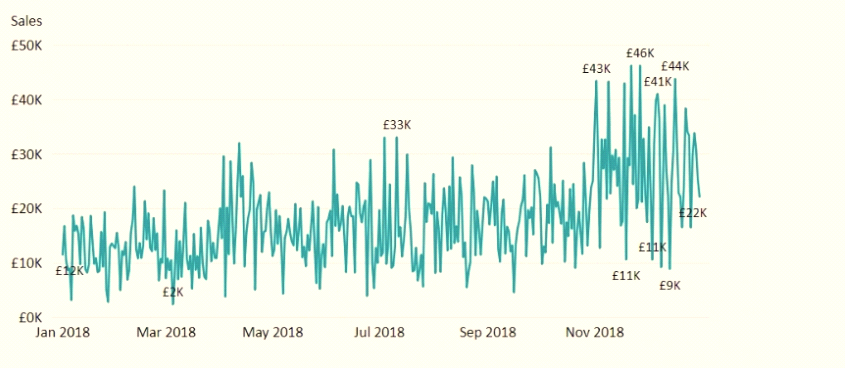
You need to configure the visual as shown in the Modified exhibit. (Click the Modified tab.)
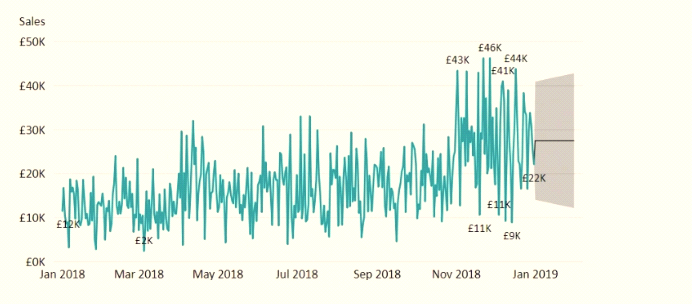
What should you add to the visual?
Suggested Answer:
C
Explore forecast results by adjusting the desired confidence interval or by adjusting outlier data to see how they affect results.

Currently there are no comments in this discussion, be the first to comment!