Deal of The Day! Hurry Up, Grab the Special Discount - Save 25% - Ends In 00:00:00 Coupon code: SAVE25

Free Preparation Discussions
 MENU
MENU
ISTQB-CTFL Exam - Topic 6 Question 65 Discussion
Actual exam question for
ISTQB's
ISTQB-CTFL exam
Question #: 65
Topic #: 6
[All ISTQB-CTFL Questions]
Topic #: 6
The following chart represents metrics related to testing of a project that was competed. Indicate what is represented by tie lines A, B and the axes X.Y
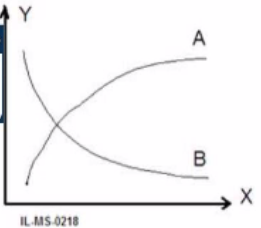
A)
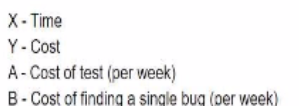
B)
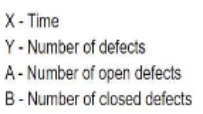
C)
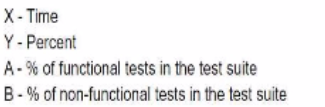
D)
Suggested Answer:
D
Option D correctly explains what is represented by the lines A, B and the axes X, Y in a testing metrics chart. According to option D:
X-axis represents Time
Y-axis represents Count
Line A represents Number of open bugs
Line B represents Total number of executed tests
This information is essential in understanding and analyzing the testing metrics of a completed project.
Currently there are no comments in this discussion, be the first to comment!