Free Preparation Discussions
IIBA CBDA Exam - Topic 1 Question 1 Discussion
Topic #: 1
A data scientist is analyzing a dataset to determine if there is a strong relationship between two variables. A measure of covariance is done. Which of the following graphs indicate Zero Covariance between variables?
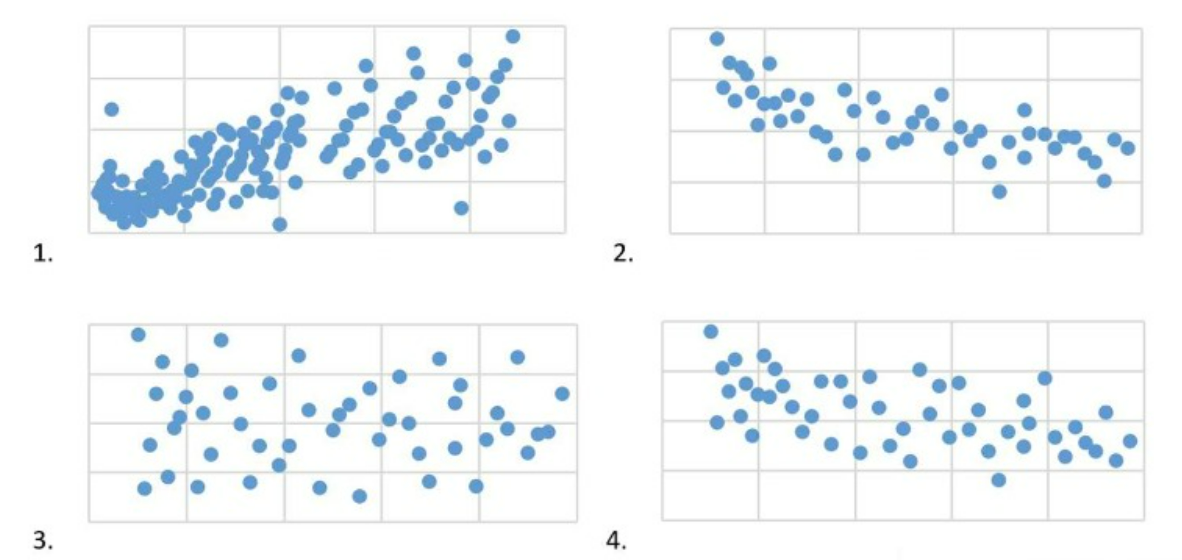
Covariance measures the directional relationship between the returns on two assets. A positive covariance means that asset returns move together while a negative covariance means they move inversely. Zero covariance indicates that the returns on the two assets move independently of each other. In the context of a scatter plot, zero covariance is represented by a plot where the points do not show any upward or downward trend but are rather scattered randomly on the graph with no discernible pattern.
Graph 4 displays such a pattern where there is no apparent relationship between the variables on the x and y axes, indicating that there is zero covariance between them.
Micheline
7 months agoShanda
7 months agoTroy
7 months agoGerri
7 months agoRoslyn
8 months agoMollie
8 months agoBenedict
8 months agoGlory
8 months agoTalia
8 months agoSherron
8 months agoDoyle
8 months agoDominque
8 months agoDianne
8 months agoCelia
9 months agoMari
9 months agoAlba
9 months agoMaira
9 months agoNobuko
2 years agoBillye
2 years agoVeronika
2 years agoRuthann
2 years ago