Free Preparation Discussions
CFA Institute CFA-Level-II Exam - Topic 2 Question 117 Discussion
Topic #: 2
Ryan Hendricks serves as a security analyst for Investment Management, Inc. (IMI), which employs the Treynor-Black model to evaluate securities and to make portfolio recommendations. IMI uses the capital asset pricing model (CAPM) to determine the degree to which securities may be mispriced relative to IMFs forecasts.
Hendricks evaluates the common shares of Computer Software Associates (CSA), a small company specializing in a unique computer software market niche. Hendricks obtains the following market model results for CSA, using monthly returns for the past 60 months:
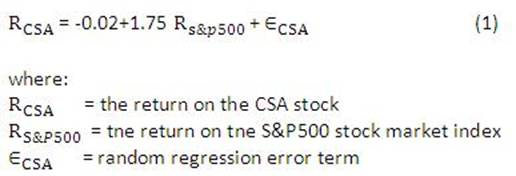
Hendricks uses the adjusted beta method to derive his forecasts for companies' future betas. In deriving his forecast for any company beta, Hendricks uses the following first-order autoregressive formula:
forecast beta = 0.33 + 0.67 x (historical beta) (2)
Hendricks derives required returns for individual securities using the CAPM after making appropriate adjustments using his adjusted beta formula in equation (2).
IMI provides Hendricks with the following capital market forecasts to use as inputs for the CAPM.
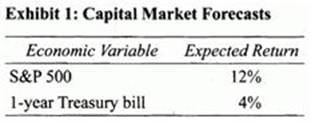
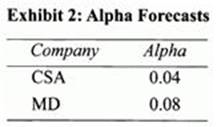
IMI asks Hendricks to make decisions to take long and short positions in individual securities for IMl's actively managed portfolio, IMI-Active. Specifically, Hendricks is asked to examine CSA and Millennium Drilling (MD), an oil and gas drilling company specializing in deep sea drilling. After a thorough examination of the prospects for each company, Hendricks derives the following alpha forecasts for CSA and MD.
Hendricks forecasts that the unsystematic variance (the variance of the market model regression error) for MD will be more than double that of CSA .
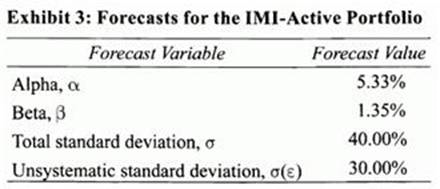
After determining the appropriate allocations across securities within the IMI-Active portfolio, Hendricks derives the portfolio predictions shown in Exhibit 3.
IMI forecasts that the total standard deviation for the S&P500 returns will equal 20%. After examining the historical forecasting abilities of Hendricks, IMI determines that Hendricks has demonstrated perfect forecasting ability in regards to CSA stock, but imperfect forecasting abilities in regards to MD stock. IMI finds that the correlation between the realized alphas for MD and the forecast MD alphas provided by Hendricks equals 0.50.
Referring to the Treynor-Black model, Hendricks makes the following statements:
Statement 1: All else equal, the Treynor-Black model increases the weight to the active portfolio as its unsystematic risk increases.
Statement 2: The Treynor-Black model is based on the premise that only a limited number of stocks should be included in the actively managed portfolio.
Using the Treynor-Black model, IMI must select optimal combinations of the S&P500 market index and the IMI-Active portfolio. The optimal combination is expected to lie along a capital allocation line with intercept and slope:
The Treynor-Black model selects optimal combinations of the passive portfolio (e.g., the S&P 500) and the actively managed portfolio (the IMI-Active portfolio). By selecting an optimal combination of the two portfolios, the new capital allocation line (CAL) will have the same intercept, but higher slope than the CAL associated with the S&P 500. The intercept of the CAL is the risk-free rate (4%, Exhibit 1), and the slope of the CAL is the Sharpe ratio for the tangency portfolio. The tangency portfolio consists of the optimal combination of the S&P 500 and the IMI-Active portfolio. The tangency portfolio is the optimal portfolio, implying that its Sharpe ratio exceeds that of any other portfolio (including the S&P 500). Therefore, the slope of the optimal portfolio will exceed the S&P 500 Sharpe ratio:
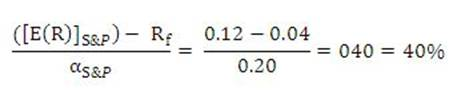
Therefore, the CAL for the optimal portfolio (combination of the S&P 500 market index and the IMI-Active portfolio) will exceed 40%. (Study Session 18, LOS 64.d and 67.b)
Ivette
2 days agoCarmen
7 days agoZona
12 days agoDominga
2 months agoBrett
2 months agoDelila
2 months ago