Free Preparation Discussions
CFA Institute CFA-Level-II Exam Questions
- Topic 1: Equity Valuation
- Topic 2: Financial Reporting and Analysis
- Topic 3: Ethical and Professional Standards .
Free CFA Institute CFA-Level-II Exam Actual Questions
Note: Premium Questions for CFA-Level-II were last updated On Jul. 15, 2026 (see below)
Amie Lear, CFA, is a quantitative analyst employed by a brokerage firm. She has been assigned by her supervisor to cover a number of different equity and debt investments. One of the investments is Taylor, Inc. (Taylor), a manufacturer of a wide range of children's toys. Based on her extensive analysis, she determines that her expected return on the stock, given Taylor's risks, is 10%. In applying the capital asset pricing model (CAPM), the result is a 12% rate of return.
For her analysis of the returns of Devon, Inc. (Devon), a manufacturer of high-end sports apparel, Lear intends to use the Fama-French model (FFM). Devon is a small-cap growth stock that has traded at a low market-to-book value in recent years. Lear's analysis has provided a wealth of quantitative information to consider. The return on a value-weighted market index minus the risk-free rate is 5.5%, the small-cap return premium is 3.1%, the value return premium is 2.2%, and the liquidity premium is 3.3%. The risk-free rate is 3.4%. The market, size, relative value, and liquidity betas for Devon are 0.7, -0.3, 1.4, and 1.2, respectively. In estimating the appropriate equity risk premium, Lear has chosen to use the Gordon growth model.
Lear's assistant, Doug Saunders, presents her with a report on macroeconomic multifactor models that includes the following two statements:
Statement 1: Business cycle risk represents the unexpected change in the difference between the return of risky corporate bonds and government bonds.
Statement 2: Confidence risk represents the unexpected change in the level of real business activity.
Lear is also attempting to determine the most appropriate method for determining the required return for Densmore, Inc. (Densmore), a closely held company that is considering a debt issue within the next year. The company has not previously issued debt securities to the public, relying instead on bank financing. She realizes that there are a number of models to consider, including the CAPM, multifactor models, and build-up models.
According to the FFM, the estimate of the required return for Devon is closest to:
Required return under FFM - risk-free rate + market beta (equity risk premium) + size beta (small-cap return premium) + value beta (value-return premium)
= 3.4% + 0.7(5.5%) + -0.3(3.1%) + 1.4(2.2%) = 9.4%
Note: The liquidity factor is only applicable to the Pastor-Stambaugh (PS) model. The PS model is otherwise the same as the FFM, save for the addition of the liquidity factor. (Study Session 10, LOS 35.d)
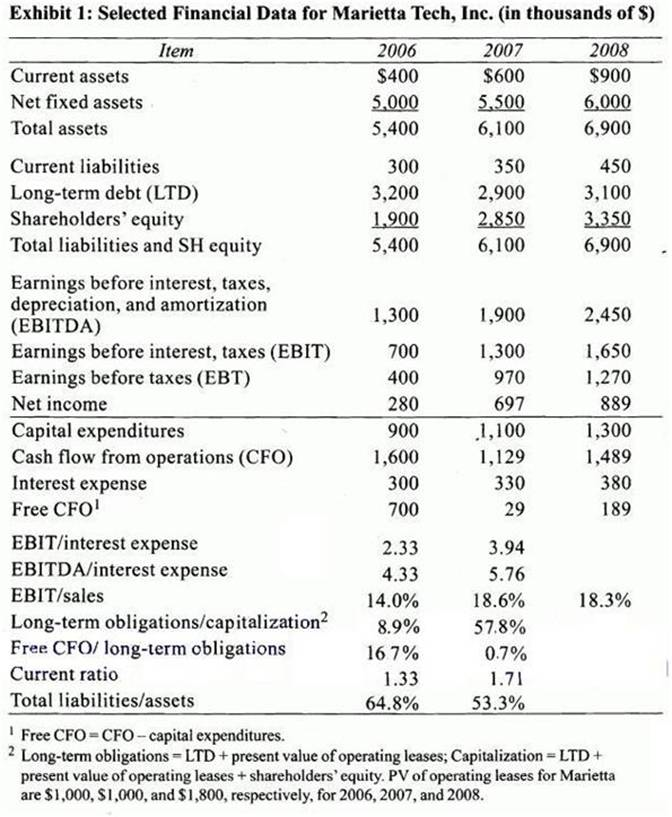
Jerry Sanders, CFA, has been asked to analyze the 20-year bonds of Marietta Tech, Inc., which are currently being held in a corporate bond portfolio managed by a colleague, and to recommend whether the bonds should be sold or held. The bonds currently have a yield spread of 1.55% over Treasuries.
Marietta Tech, Inc. designs, manufactures, and markets specialty trucks and truck bodies mounted on new truck chassis produced by others, including concrete mixers, refuse bodies, fire and emergency vehicles, defense trucks, cut-away and dry freight van bodies, refrigerated units, stake bodies, and other specialized trucks. Marietta also manufactures fiberglass wind deflectors, armored trucks, shuttle buses, and cargo vans. Marietta's customers are located in the United States and Canada.
Exhibit 1: Selected Financial Data for Marietta Tech, Inc. (in thousands of $)
At lunch Sanders discusses the credit analysis of various types of bonds with Elizabeth Yan, who was just hired as a bond analyst. Yan makes the following statements:
Statement 1: An analysis of the issuer's business and operating risks is important to the analysis of corporate bond credit risk but not important for the credit analysis of asset backed securities (ABS).
Statement 2: The unique bond covenants in a municipal bond's trust indenture require an additional level of credit analysis not necessary in a corporate credit analysis.
After lunch Sanders asks Tatiana Petrovich in the municipal bond department for her opinion on the most important factors in the risk assessment of tax-backed municipal debt. Petrovich identifies three factors:
1. Ameasure of debt burden, such as debt-per-capita in the tax jurisdiction.
2. An evaluation of tax collection rates and intergovernmental revenue ability.
3. Analysis of the municipality's budgetary policies as an indication of financial discipline.
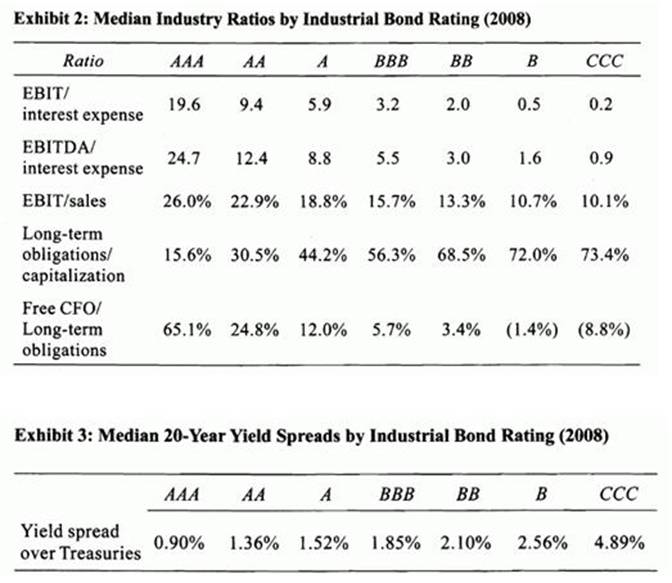
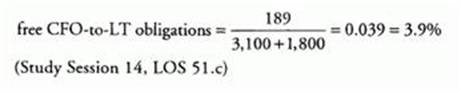
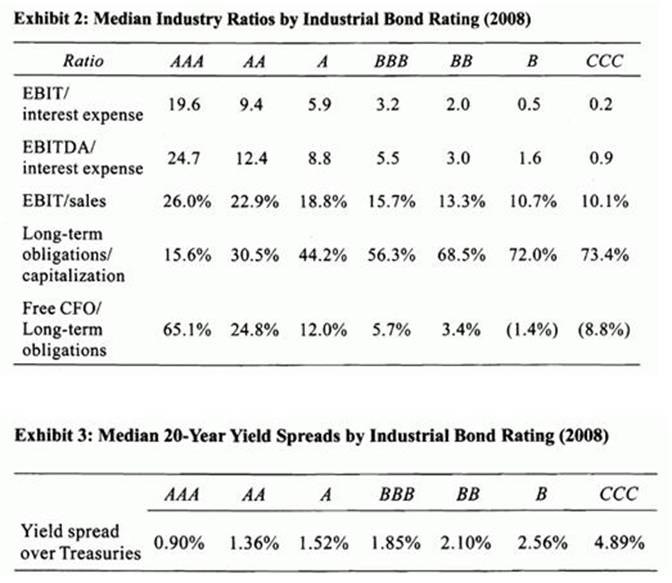
Compare the 2008 free CFO-to-long-term obligations ratio benchmarks to Marietta's ratio. Marietta is between the:
Marietta's free CFO-to-LT obligations ratio of 3.9% is between the BBB median (5.7%) and the BB median (3.4%).
Lena Pilchard, research associate for Eiffel Investments, is attempting to measure the value added to the Eiffel Investments portfolio from the use of 1-year earnings growth forecasts developed by professional analysts.
Pilchard's supervisor, Edna Wilms, recommends a portfolio allocation strategy that overweights neglected firms. Wilms cites studies of the "neglected firm effect," in which companies followed by a small number of professional analysts are associated with higher returns than firms followed by a larger number of analysts. Wilms considers a company covered by three or fewer analysts to be "neglected."
Pilchard also is aware of research indicating that, on average, stock returns for small firms have been higher than those earned by large firms. Pilchard develops a model to predict stock returns based on analyst coverage, firm size, and analyst growth forecasts. She runs the following cross-sectional regression using data for the 30 stocks included in the Eiffel Investments portfolio:
Ri = b0 + b,COVERAGEi + b2 LN(SIZEi) + b3(FORECASTi) + ei
where:
Ri = the rate of return on stock i
COVERAGEi = one if there are three or fewer analysts covering stock
i, and equals zero otherwise
LN(SIZEi) = the natural logarithm of the market capitalization
(stock price times shares outstanding) for stock i,
units in millions
FORECASTi = the 1-year consensus earnings growth rate forecast for stock i
Pilchard derives the following results from her cross-sectional regression:
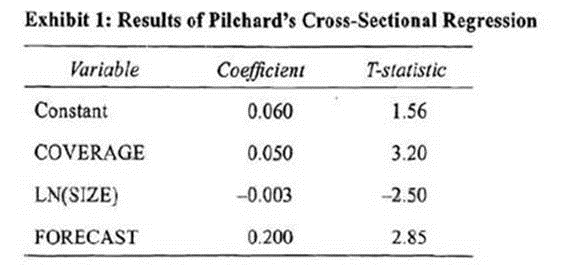
The standard error of estimate in Pilchard's regression equals 1.96 and the regression sum of squares equals 400.
Wilrus provides Pilchard with the following values for analyst coverage, firm size, and earnings growth forecast for Eggmann Enterprises, a company that Eiffel Investments is evaluating.
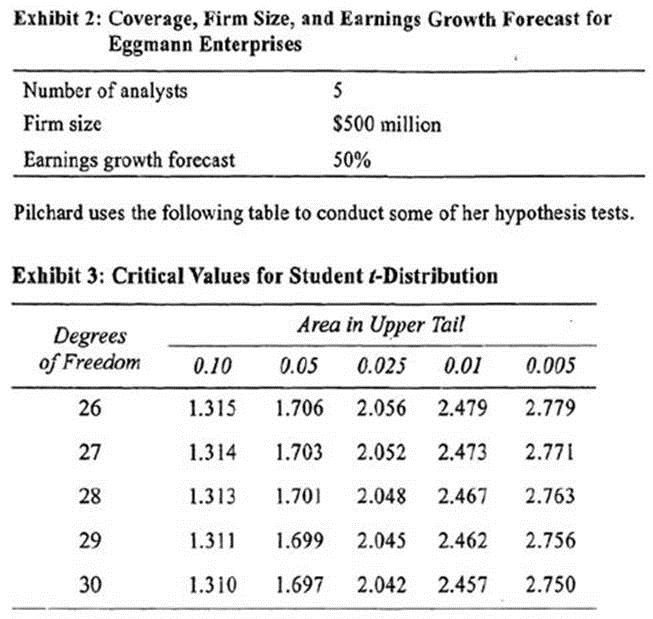
Wilms asks Pilchard to derive the lowest possible value for the coefficient on the FORECAST variable using a 99% confidence interval. The appropriate lower bound for the FORECAST coefficient is closest to;
The standard error can be determined by knowing the formula for the t-statistic:
t-statistic - (slope estimate - hypothesized value) / standard error
Therefore, the standard error equals:
standard error = (slope estimate --- hypothesized value) / t-statistic
The null hypothesis associated with each of the /-statistics reported for the slope estimates in Table 1 is: : slope = zero. So, the standard error equals the slope estimate divided by its /-statistic: 0.2000 / 2.85 = 0.07.
The confidence interval equals; slope estimate { x standard error), where is the critical t-statistic associated with the desired confidence interval (as stated in the question, the desired confidence interval equals 99%)- Exhibit 3 provides crirical values for a portion of the Student t-distribution. The appropriate critical value is found by using the correct significance level and degrees of freedom. The significance level equals 1 minus the confidence level - 1 - 0.99 = 0.01. The degrees of freedom equal N - k --- I, where k is the number of independent variables: 30-3-1 =26 degrees of freedom. Note that the table provides critical values for one-tail tests of hypothesis ('area in upper tail'). Therefore, the appropriate critical value for the 99% confidence interval is found under the column labeled '0.005,' indicating that the upper tall comprises 0.5% of the t-distribution, and the lower tail comprises an equivalent 0.5% of the distribution. Therefore, the two tails, combined, take up 1% of the distribution. The correct critical t-statistic for the 0.01 significance level equals 2.779. Therefore, the 99% confidence interval for the FORECAST slope coefficient is:
0.2000 2.779(0.07) = (0.0055, 0.3945)
The lower bound equals 0.0055 and the upper bound equals 0.3945. (Study Session 3. LOS11.f and 12.c)
Mary Montpicr is an equity analyst with World Renowned Advisors. The firm provides investment advice and financial planning services globally to institutional and retail clients. Shortly after the company opened an office in Malaysia, Montpier's supervisor in the New York office. Rick Reynolds, asked her to relocate, and Montpier agreed. The goal of the new Malaysian office is to serve as a source of international investment opportunities for U .S . clients. Montpier's main task is to cover small-cap stocks in the region and develop a network of contacts with other investment firms in the region.
Through her interaction with other analysts in Malaysia, Montpier learns that the use of material nonpublic information is common practice in analyst research reports and recommendations. Such practice is not prohibited by law in Malaysia. Montpier is encouraged by this knowledge because she recently observed several investment bankers meeting numerous times at an exclusive local country club with the CEOs of two Malaysian rival companies. It is public information that one of the companies is searching for potential acquisition targets. She has thought several times about issuing a recommendation on one of the companies but has not done so for fear of breaking the law. After learning of the Malaysian insider trading laws, Montpier recommends the stock of the acquisition target, which she had already established as a good investment through prior research.
Montpier has also learned that Malaysian law is very lax regarding outside consulting arrangements by investment professionals. It is common for analysts and portfolio managers to maintain ongoing consulting contracts with entities other than their primary employer. As a result of this, Montpier has begun financial service consultations for members of a local investment club. The club is developing an appropriate compensation package for her services, which to date have included financial planning activities and investment research. When Montpier established the relationship with the investment club, she informed them that she had a full-time job at World Renowned Advisers, which offers similar services.
After a year of consulting with the investment club, Malaysian law changed, requiring investment bankers, securities analysts, and portfolio managers to register with the Malaysian Securities Commission in order to engage in independent consulting practice. Since she is unaware of the change, Montpier does not file the proper registration forms and is later investigated, fined, and temporarily sanctioned by the Malaysian Securities Commission. Montpier is able to have the sanction, but not the fine, removed after appealing the Commission's ruling. Montpier's counterpart in the New York office is Jim Taylor, who has worked as an analyst at World Renowned Advisors for approximately seven years. Taylor researches health care and biotech stocks for the firm and participates in client meetings when managers are recommending stocks that Taylor covers. Taylor recently completed Level 1 of the CFA examination and is waiting for his results so he can register for the Level 2 examination.
In preparation for a client meeting, Taylor's supervisor, Jessica James, asks him to prepare a research report on attractive companies in the health care industry. Since Taylor is busy preparing for company conference calls, James tells him to "throw something together from the street." To meet James' request, Taylor obtains reports on Immune Healthcare and Remedy Corp., two companies that he has heard about but has not researched. Taylor takes the original reports he obtains from a third-party, adds some general industry information, and submits "strong buy" recommendations to James for the stocks. He does not credit the original authors in the report, which is a violation of copyright law. Taylor includes his qualifications in the report and mentions that he is a "Level 2 Candidate in the CFA Program." Although written procedures require James to review all analyst reports prior to release, time constraints often prevent her from reviewing the reports prior to distribution. James recommends the stocks to her clients, who then purchase them. Several months later, the clients are able to sell the Immune Healthcare and Remedy Corp. shares at annualized rates of return of 21% and 17%, respectively. James informs Taylor of the clients' successful investments and requests that he begin investigating potential biotech investments for the same group of investors.
To gain insight on biotech stocks, Taylor registers for an upcoming medical study, where he and others will be the subject of testing for the efficacy of several new drugs. On his application, Taylor indicates that he has the appropriate medical condition for the study and signs a confidentiality agreement, but he leaves the question about his occupation blank. During the study, Taylor learns that two of the new drugs on which Next Breakthrough Corp. is awaiting regulatory approval have serious negative side effects in patient testing. This information confirms existing research that Taylor has been working on in the health care sector. At the conclusion of the study, Taylor sends an e-mail to his clients recommending that they "sell" Next Breakthrough Corp. Over the next two weeks. Next Breakthrough releases information that the drugs in question have been held up by a regulatory agency pending additional investigation. The stock plunges over 30% on the news.
By not filing the proper registration forms with the Malaysian Securities Commission, did Montpier likely violate any CFA Institute Standards of Professional Conduct?
Montpier has violated Standard I (A) Knowledge of the Law. It is a good idea for members to meet the compliance officer when starting a new job and periodically thereafter to keep informed about appropriate rules and regulations within the organization and in the regulatory environment that governs the member's job responsibilities. This may be especially important if the member changes job functions or relocates to another location or jurisdiction. Maintaining current Hies of appropriate statutes, rules, and regulations, as well as internal policies and procedures, is also effective for maintaining compliance. (Study Session 1, LOS 2.a)
Jerry Sanders, CFA, has been asked to analyze the 20-year bonds of Marietta Tech, Inc., which are currently being held in a corporate bond portfolio managed by a colleague, and to recommend whether the bonds should be sold or held. The bonds currently have a yield spread of 1.55% over Treasuries.
Marietta Tech, Inc. designs, manufactures, and markets specialty trucks and truck bodies mounted on new truck chassis produced by others, including concrete mixers, refuse bodies, fire and emergency vehicles, defense trucks, cut-away and dry freight van bodies, refrigerated units, stake bodies, and other specialized trucks. Marietta also manufactures fiberglass wind deflectors, armored trucks, shuttle buses, and cargo vans. Marietta's customers are located in the United States and Canada.
Exhibit 1: Selected Financial Data for Marietta Tech, Inc. (in thousands of $)

At lunch Sanders discusses the credit analysis of various types of bonds with Elizabeth Yan, who was just hired as a bond analyst. Yan makes the following statements:
Statement 1: An analysis of the issuer's business and operating risks is important to the analysis of corporate bond credit risk but not important for the credit analysis of asset backed securities (ABS).
Statement 2: The unique bond covenants in a municipal bond's trust indenture require an additional level of credit analysis not necessary in a corporate credit analysis.
After lunch Sanders asks Tatiana Petrovich in the municipal bond department for her opinion on the most important factors in the risk assessment of tax-backed municipal debt. Petrovich identifies three factors:
1. Ameasure of debt burden, such as debt-per-capita in the tax jurisdiction.
2. An evaluation of tax collection rates and intergovernmental revenue ability.
3. Analysis of the municipality's budgetary policies as an indication of financial discipline.
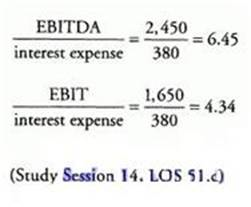
Sanders first analyzes Marietta's 2008 EBIT-to-interest expense and EBITDA-to-interest expense and compares them to the median ratios from Exhibit 2. Relative to the BBB medians for the respective ratios:
Both the 2008 EBITDA/interest and the EBIT/interest ratios for Marietta are greater than their comparable indusuy medians of 5.5 and 3.2, icspcctivcly.
- Select Question Types you want
- Set your Desired Pass Percentage
- Allocate Time (Hours : Minutes)
- Create Multiple Practice tests with Limited Questions
- Customer Support
Chiara Fedorov
6 days agoTiffany Anderson
21 days agoDavid Baker
1 month agoJoshua Carter
2 months agoFrank Turner
3 months agoBarbara Carter
3 months agoJoshua Lee
3 months agoMichael Johnson
2 months agoAndrew Anderson
2 months agoAndrew Phillips
3 months agoLaura Martinez
3 months agoCecily
4 months agoHelaine
4 months agoTerrilyn
4 months agoElmira
4 months agoCaitlin
5 months agoGerman
5 months agoViki
5 months agoFletcher
5 months agoWilliam
6 months agoHaydee
6 months agoJeffrey
6 months agoJani
6 months agoRoyce
7 months agoNadine
7 months agoEmiko
7 months agoChuck
7 months agoStanford
8 months agoDeonna
8 months agoEleni
8 months agoErick
8 months agoKizzy
9 months agoDeane
9 months agoJeannine
9 months agoSkye
9 months agoJudy
10 months agoAshleigh
10 months agoDylan
10 months agoVirgina
11 months agoPaola
11 months agoCorinne
1 year agoFelice
1 year agoNickolas
1 year agoCyndy
1 year agoJosphine
2 years agoBong
2 years agoMabel
2 years agoSanda
2 years agoDyan
2 years agoOmega
2 years agoRoy
2 years agoBillye
2 years agoSherell
2 years agoMichel
2 years agoLeslie
2 years agoLinette
2 years agoWade
2 years agoCletus
2 years agoFloyd
2 years agoGraciela
2 years agoGeorgene
2 years agoIsreal
2 years ago