
 MENU
MENU
Lena Pilchard, research associate for Eiffel Investments, is attempting to measure the value added to the Eiffel Investments portfolio from the use of 1-year earnings growth forecasts developed by professional analysts.
Pilchard's supervisor, Edna Wilms, recommends a portfolio allocation strategy that overweights neglected firms. Wilms cites studies of the "neglected firm effect," in which companies followed by a small number of professional analysts are associated with higher returns than firms followed by a larger number of analysts. Wilms considers a company covered by three or fewer analysts to be "neglected."
Pilchard also is aware of research indicating that, on average, stock returns for small firms have been higher than those earned by large firms. Pilchard develops a model to predict stock returns based on analyst coverage, firm size, and analyst growth forecasts. She runs the following cross-sectional regression using data for the 30 stocks included in the Eiffel Investments portfolio:
Ri = b0 + b,COVERAGEi + b2 LN(SIZEi) + b3(FORECASTi) + ei
where:
Ri = the rate of return on stock i
COVERAGEi = one if there are three or fewer analysts covering stock
i, and equals zero otherwise
LN(SIZEi) = the natural logarithm of the market capitalization
(stock price times shares outstanding) for stock i,
units in millions
FORECASTi = the 1-year consensus earnings growth rate forecast for stock i
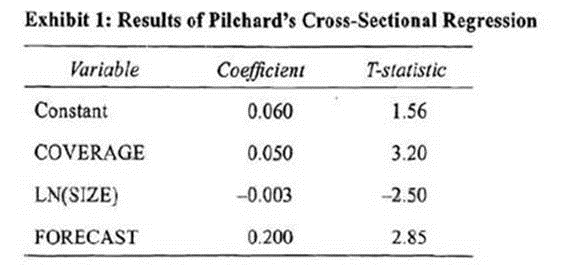
Pilchard derives the following results from her cross-sectional regression:
The standard error of estimate in Pilchard's regression equals 1.96 and the regression sum of squares equals 400.
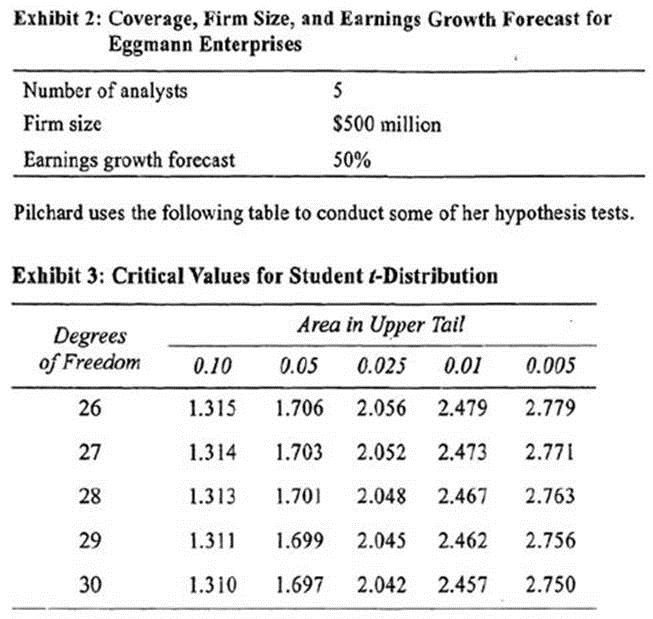
Wilrus provides Pilchard with the following values for analyst coverage, firm size, and earnings growth forecast for Eggmann Enterprises, a company that Eiffel Investments is evaluating.
Wilms asks Pilchard to derive the lowest possible value for the coefficient on the FORECAST variable using a 99% confidence interval. The appropriate lower bound for the FORECAST coefficient is closest to;
The standard error can be determined by knowing the formula for the t-statistic:
t-statistic - (slope estimate - hypothesized value) / standard error
Therefore, the standard error equals:
standard error = (slope estimate --- hypothesized value) / t-statistic
The null hypothesis associated with each of the /-statistics reported for the slope estimates in Table 1 is: : slope = zero. So, the standard error equals the slope estimate divided by its /-statistic: 0.2000 / 2.85 = 0.07.
The confidence interval equals; slope estimate { x standard error), where is the critical t-statistic associated with the desired confidence interval (as stated in the question, the desired confidence interval equals 99%)- Exhibit 3 provides crirical values for a portion of the Student t-distribution. The appropriate critical value is found by using the correct significance level and degrees of freedom. The significance level equals 1 minus the confidence level - 1 - 0.99 = 0.01. The degrees of freedom equal N - k --- I, where k is the number of independent variables: 30-3-1 =26 degrees of freedom. Note that the table provides critical values for one-tail tests of hypothesis ('area in upper tail'). Therefore, the appropriate critical value for the 99% confidence interval is found under the column labeled '0.005,' indicating that the upper tall comprises 0.5% of the t-distribution, and the lower tail comprises an equivalent 0.5% of the distribution. Therefore, the two tails, combined, take up 1% of the distribution. The correct critical t-statistic for the 0.01 significance level equals 2.779. Therefore, the 99% confidence interval for the FORECAST slope coefficient is:
0.2000 2.779(0.07) = (0.0055, 0.3945)
The lower bound equals 0.0055 and the upper bound equals 0.3945. (Study Session 3. LOS11.f and 12.c)