Deal of The Day! Hurry Up, Grab the Special Discount - Save 25% - Ends In 00:00:00 Coupon code: SAVE25

Free Preparation Discussions
 MENU
MENU
BCS TM12 Exam - Topic 1 Question 70 Discussion
Actual exam question for
BCS's
TM12 exam
Question #: 70
Topic #: 1
[All TM12 Questions]
Topic #: 1
After the presentation, you are asked to explain the chart.
Assume you have applied a full risk-based testing strategy.
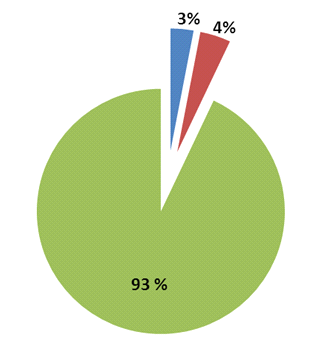
Which of the following answers would you expect to best describe the pie chart?
Number of correct responses: 1
Suggested Answer:
C
Lenna
10 months agoLisandra
10 months agoAmalia
11 months agoCandra
11 months agoAlfred
11 months agoAndrew
11 months agoViva
11 months agoJohanna
11 months agoMelissa
11 months agoBambi
11 months agoNu
12 months agoJeannetta
12 months agoRosalind
12 months ago