Deal of The Day! Hurry Up, Grab the Special Discount - Save 25% - Ends In 00:00:00 Coupon code: SAVE25
Free Preparation Discussions
ASQ CQE Exam - Topic 5 Question 23 Discussion
Actual exam question for
ASQ's
CQE exam
Question #: 23
Topic #: 5
[All CQE Questions]
Topic #: 5
An electronics firm was experiencing high rejections in their multiple connector manufacturing departments. "p" charts were introduced as part of a program to reduce defectives. Control limits were based on prior history, using the formula:
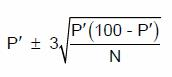
P' is the historical value of percent defective and n is the number of pieces inspected each week. After six weeks, the following record was accumulated
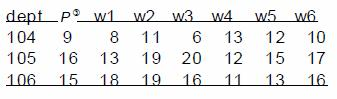
1,000 pieces were inspected each week in each department. Which department(s) exhibited a point or points out of control during this period (round off calculations to nearest tenth of a percentage point)?
Suggested Answer:
D
Oliva
8 months agoLennie
9 months agoStephaine
9 months agoMaryln
9 months agoLashon
9 months agoAnglea
9 months agoFernanda
9 months ago