Deal of The Day! Hurry Up, Grab the Special Discount - Save 25% - Ends In 00:00:00 Coupon code: SAVE25

Welcome to Pass4Success

- Free Preparation Discussions

SAS A00-240 Exam - Topic 1 Question 14 Discussion

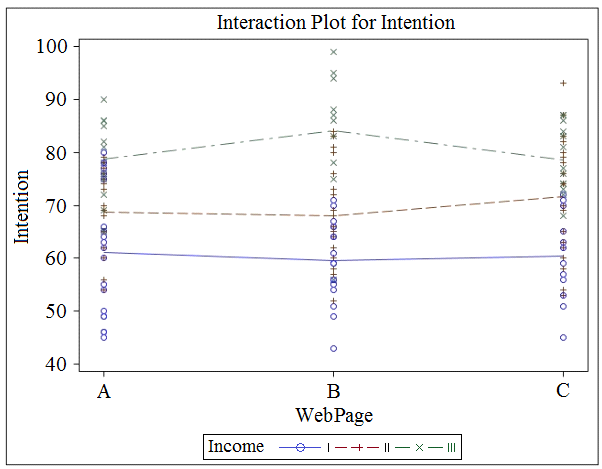
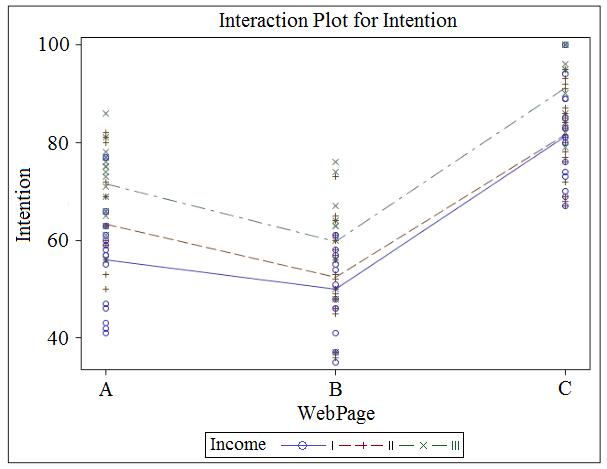
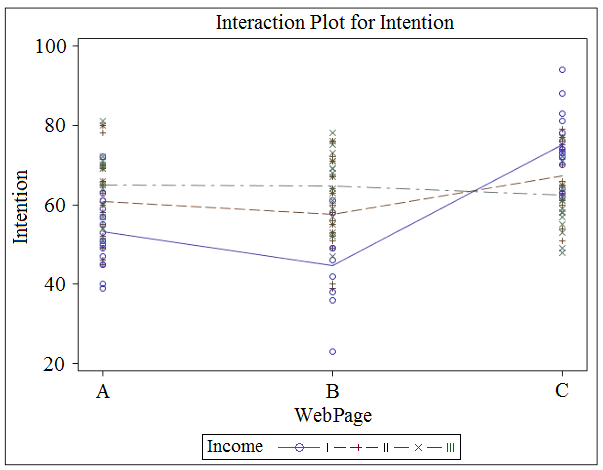
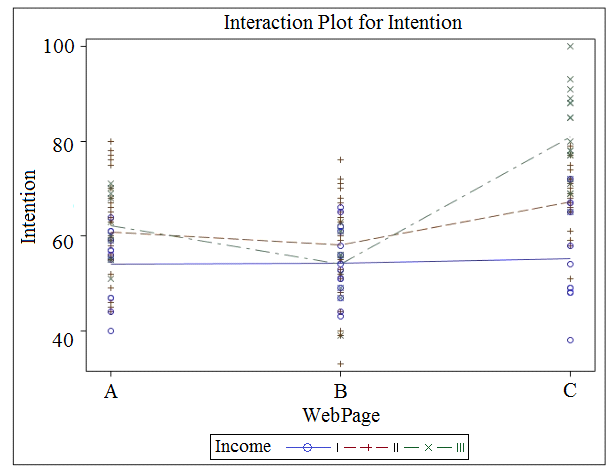
A marketing analyst assessed the effect of web page design (A, B, or C) on customers' intent to purchase an expensive product. The focus group was divided randomly into three sub-groups, each of which was asked to view one of the web pages and then give their intent to purchase on a scale from 0 to 100. The analyst also asked the customers to give their income, which was coded as: I (lowest), II (medium), or III (highest). After analyzing the data, the analyst claimed that there was significant interaction and the webpage design mainly influenced high income people.Which graph supports the analyst's conclusion?A)B)C)D)
A) Option A
B) Option B
C) Option C
D) Option D

SAS A00-240 Exam - Topic 1 Question 14 Discussion

Actual exam question for SAS's A00-240 exam
Question #: 14
Topic #: 1
[All A00-240 Questions]

A marketing analyst assessed the effect of web page design (A, B, or C) on customers' intent to purchase an expensive product. The focus group was divided randomly into three sub-groups, each of which was asked to view one of the web pages and then give their intent to purchase on a scale from 0 to 100. The analyst also asked the customers to give their income, which was coded as: I (lowest), II (medium), or III (highest). After analyzing the data, the analyst claimed that there was significant interaction and the webpage design mainly influenced high income people.

Which graph supports the analyst's conclusion?

A)
B)
C)
D)
Show Suggested Answer Hide Answer
Suggested Answer: A

Contribute your Thoughts:

0/2000 characters
Melda
10 months ago
Income level really changes the results, huh?
upvoted 0 times
...
Josefa
10 months ago
Wait, how can they say it mainly influenced high income?
upvoted 0 times
...
Refugia
11 months ago
Not so sure about that, B seems strong too.
upvoted 0 times
...
Jamika
11 months ago
Definitely agree, C looks like the best fit!
upvoted 0 times
...
Val
11 months ago
I think Option C shows the highest intent for high income.
upvoted 0 times
...
Tomas
11 months ago
I feel like I’ve seen a similar question before, and I think the graph needs to show a stronger effect for high-income people to support the analyst's claim.
upvoted 0 times
...
Jestine
11 months ago
I think it might be Option C because it seems to show a clear difference in intent to purchase for high-income individuals compared to the others.
upvoted 0 times
...
Allene
11 months ago
I remember we discussed how interaction effects can show different trends for different groups, but I'm not sure which graph illustrates that best here.
upvoted 0 times
...
Shizue
11 months ago
I’m a bit confused about the graphs. I thought the interaction would be more pronounced, but I can't tell which one really highlights that.
upvoted 0 times
...
Launa
11 months ago
I'm pretty confident I know the answer to this one. High availability vaults are designed for mission-critical systems where downtime is unacceptable. The question is asking about a good use case, and I believe the first option about Recovery Time and Recovery Point Objectives being near zero is the correct answer.
upvoted 0 times
...
Lavonna
12 months ago
This question seems straightforward - value is subjective, so we need a deliberate approach to fully realize it. Option A looks like the best answer.
upvoted 0 times
...
Alpha
12 months ago
In banking, trust is everything. Option B looks right - crimes like fraud or embezzlement would disqualify someone from handling financial transactions.
upvoted 0 times
...

Save Cancel