
 MENU

Given the partial report shown below:
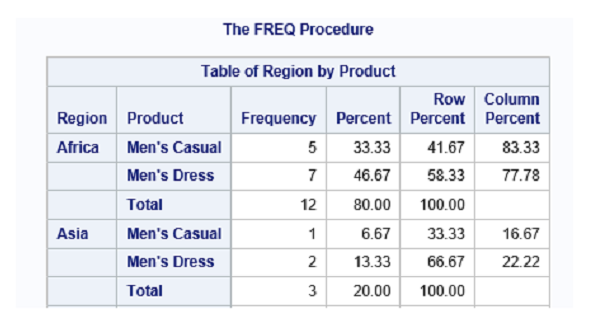
Which step will produce this report?
The report shown is a cross-tabulation of 'Region' by 'Product'. The FREQ Procedure indicates that PROC FREQ has been used, and the presence of 'Frequency', 'Percent', 'Row Percent', and 'Column Percent' suggests that a cross tabulation (or contingency table) has been requested. The correct code for this output would include the tables statement to specify the two variables ('Region' and 'Product') with an asterisk between them, which indicates a request for a cross-tabulation of these two categorical variables, and the crosslist option to display the table in a cross-tabulated list format. Therefore, option D is the correct answer:
proc freq data=sashelp.shoes;
tables region*product / crosslist;
run;
Options A and C use the order=freq option incorrectly, as this option would order the table by frequency counts rather than providing a cross-tabulation. Option B is missing the crosslist option needed to produce the cross-tabulated format.
Currently there are no comments in this discussion, be the first to comment!