Free Preparation Discussions
Salesforce Marketing Cloud Intelligence Accredited Professional (AP-215) Exam Questions
- Topic 1: General Functionalities: In this topic, Salesforce marketing professionals will explore core functionalities of Marketing Cloud Intelligence. It measures understanding of platform features critical to data-driven marketing strategies and insights.
- Topic 2: Data Integration Code Ability: This section evaluates proficiency with common Marketing Cloud Intelligence functions, enabling Salesforce marketing professionals to integrate diverse data sources effectively for comprehensive marketing intelligence.
- Topic 3: Mapping: Marketing professionals will focus on Marketing Cloud Intelligence ingestion capabilities, assessing knowledge of data mapping processes and outcomes critical to efficient data organization.
- Topic 4: Data Update Permissions: This area tests knowledge of permissions and settings related to data updates. It includes understanding parent-child setups and managing the "Source of Truth" for data accuracy.
- Topic 5: Harmonization Best Practices: Salesforce marketing professionals will analyze harmonization methods, properties, and their advantages and disadvantages, enhancing skills for optimizing data consistency across platforms.
- Topic 6: Vlookup: This section evaluates proficiency of marketing professionals in Vlookup statements and their properties, ensuring accurate data referencing and streamlined data manipulation for marketing intelligence tasks. Overarching Entities: Salesforce marketing professionals will deepen their understanding of overarching entities, their use cases, and application, crucial for strategic data organization and analysis.
- Topic 7: Data Fusion: This topic focuses on the use cases and properties of Data Fusion, equipping marketing professionals to merge datasets effectively for comprehensive marketing insights.
- Topic 8: Calculated Dimensions & Measurements: This section measures skills in using calculated objects, recognizing aggregation types, and employing these tools for tailored marketing analytics.
- Topic 9: Harmonization Center (Patterns/Data Classification/Validation): Salesforce marketing professionals will learn about the Harmonization Center’s capabilities, including classification rules, validation lists, patterns, and harmonized dimensions to ensure data reliability.
- Topic 10: CRM: This topic tests knowledge of CRM properties and their behavior within Marketing Cloud Intelligence. This knowledge is crucial for syncing customer relationship data with marketing campaigns.
- Topic 11: QA Ability: This section focuses on common QA steps for various scenarios, enabling Salesforce marketing professionals to ensure data quality and platform performance.
- Topic 12: Data Model: In this domain, marketing professionals will explore data model entities, their relationships, and attributes within Marketing Cloud Intelligence.
- Topic 13: Design Feasibility: This area evaluates the ability to identify valid and invalid solutions from solution design diagrams, ensuring effective and scalable platform designs.
Free Salesforce Marketing Cloud Intelligence Accredited Professional (AP-215) Exam Actual Questions
Note: Premium Questions for Marketing Cloud Intelligence Accredited Professional (AP-215) were last updated On Jun. 21, 2026 (see below)
An implementation engineer is requested to create the harmonization field - Magician
This field should come from multiple Twitter Ads data streams, and should follow the below logic:
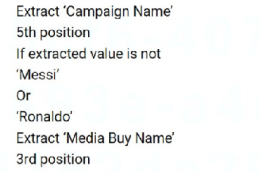
Using the Harmonization Center, the engineer created a single Pattern for Campaign Name. What other action should the engineer take to meet the requirements?
For the field 'Magician', the engineer is required to follow a logic that extracts a value from 'Campaign Name' and checks against a validation list for specific values ('Messi' or 'Ronaldo'). If those values are not found, it should instead extract from 'Media Buy Name'. To accomplish this, the engineer should:
Use the created Pattern for 'Campaign Name'.
Create a second Pattern for 'Media Buy Name' to capture the fallback values.
Apply two Classification Rules to the Harmonized Dimension: one for the value 'Messi' and another for 'Ronaldo'. This is to check the extracted 'Campaign Name' against these specific values.
These steps ensure that the 'Magician' field will be populated with the correct values from the respective data streams following the specified logic.
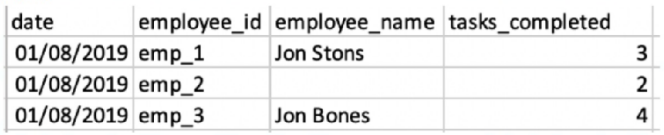
A client has integrated the following files:
File A:
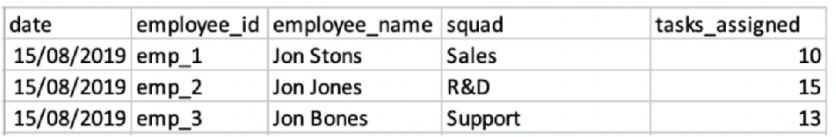
File B:
The client would like to link the two files in order to view the two KPIs ('Tasks Completed' and 'Tasks Assigned) alongside 'Employee Name' and/or
'Squad'.
The client set the following properties:
+ File A is set as the Parent data stream
* Both files were uploaded to a generic data stream type.
* Override Media Buy Hierarchies is checked for file A.
* The 'Data Updates Permissions' set for file B is 'Update Attributes and Hierarchy'.
When filtering on the entire date range (1-30/8), and querying employee ID, Name and Squad with the two measurements - what will the result look like?
A)
B)
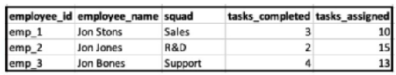
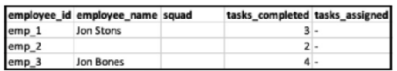
C)
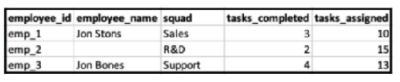
D)
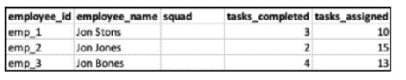
In Marketing Cloud Intelligence, when linking two data streams, the parent data stream (File A) provides the main structure. Since 'Override Media Buy Hierarchies' is checked for File A, the hierarchies from File B will be aligned with File A. Given 'Data Updates Permissions' set for file B as 'Update Attributes and Hierarchy', this means that attributes and hierarchy will be updated in the parent file based on the child file (File B), but the child file's metrics won't be associated with the parent file's date.
Hence, when filtering on the entire date range (1-30/8), the resulting view will align with the structure of the parent data stream, showing the KPIs ('Tasks Completed' from File A and 'Tasks Assigned' from File B) alongside the employee names and squads from the respective files. Since the employee IDs align, the data can be linked properly. However, since the dates do not align (File A data is from 01/08/2019 and File B from 15/08/2019), only attributes from File B will be updated without date association.
The result will look like Option C, where the employee names are corrected based on File B's data, the squads are added from File B, and the tasks_completed and tasks_assigned are displayed from their respective files. The tasks_assigned from File B are shown without date association as File B's date doesn't match with File A's.
An implementation engineer is requested to integrate the following files:
File A:

File B:

The client would like to link the two files in order to view the two KPIS (Tasks Completed' and 'tasks Assignmed') alongside'Employee Name' and/or 'Squard'.
A Parent-Child configuration was set between the two.
Which two statements are correct?
In Marketing Cloud Intelligence, joining two files requires a common field to be mapped as the same entity. If 'employee_name' is consistently mapped across both data streams, it can serve as the basis for the join, regardless of whether 'employee_id' is mapped. The choice of which file serves as the Parent stream depends on the use case and the desired reporting structure, but technically, either could serve as the Parent.
A client has integrated the following files:
File A:
File B:
The client would like to link the two files in order to view the two KPIs ('Tasks Completed' and 'Tasks Assigned) alongside 'Employee Name' and/or
'Squad'.
The client set the following properties:
+ File A is set as the Parent data stream
* Both files were uploaded to a generic data stream type.
* Override Media Buy Hierarchies is checked for file A.
* The 'Data Updates Permissions' set for file B is 'Update Attributes and Hierarchy'.
When filtering on the entire date range (1-30/8), and querying employee ID, Name and Squad with the two measurements - what will the result look like?
A)
B)
C)
D)
In Marketing Cloud Intelligence, when linking two data streams, the parent data stream (File A) provides the main structure. Since 'Override Media Buy Hierarchies' is checked for File A, the hierarchies from File B will be aligned with File A. Given 'Data Updates Permissions' set for file B as 'Update Attributes and Hierarchy', this means that attributes and hierarchy will be updated in the parent file based on the child file (File B), but the child file's metrics won't be associated with the parent file's date.
Hence, when filtering on the entire date range (1-30/8), the resulting view will align with the structure of the parent data stream, showing the KPIs ('Tasks Completed' from File A and 'Tasks Assigned' from File B) alongside the employee names and squads from the respective files. Since the employee IDs align, the data can be linked properly. However, since the dates do not align (File A data is from 01/08/2019 and File B from 15/08/2019), only attributes from File B will be updated without date association.
The result will look like Option C, where the employee names are corrected based on File B's data, the squads are added from File B, and the tasks_completed and tasks_assigned are displayed from their respective files. The tasks_assigned from File B are shown without date association as File B's date doesn't match with File A's.
A technical architect is provided with the logic and Opportunity file shown below:
The opportunity status logic is as follows:
For the opportunity stages ''Interest'', ''Confirmed Interest'' and ''Registered'', the status should be ''Open''.
For the opportunity stage ''Closed'', the opportunity status should be closed.
Otherwise, return null for the opportunity status.

Given the above file and logic and assuming that the file is mapped in a GENERIC data stream type with the following mapping:
''Day'' --- Standard ''Day'' field
''Opportunity Key'' > Main Generic Entity Key
''Opportunity Stage'' --- Generic Entity Key 2
''Opportunity Count'' --- Generic Custom Metric
A pivot table was created to present the count of opportunities in each stage. The pivot table is filtered on Jan 7th - 10th. How many different stages are presented in the table?
Based on the Opportunity file and considering the filter dates from January 7th to 10th, the different stages presented are 'Interest', 'Confirmed Interest', and 'Registered'. This makes a total of 3 different stages that would be presented in the pivot table. Salesforce Marketing Cloud Intelligence allows for the creation of pivot tables that can display counts of entities across different dimensions, in this case, Opportunity Stages. Reference to Salesforce Marketing Cloud Intelligence documentation that covers data mapping and pivot table creation would support this conclusion.
- Select Question Types you want
- Set your Desired Pass Percentage
- Allocate Time (Hours : Minutes)
- Create Multiple Practice tests with Limited Questions
- Customer Support
Michael Carter
12 days agoPaul Harris
19 days agoWilliam Flores
1 month agoSharon Scott
2 months agoJames Campbell
2 months agoDonald Turner
2 months agoMonica Cook
2 months agoDennis Cooper
2 months agoKaren Hernandez
1 month agoNancy Anderson
1 month agoFelix
3 months agoLynelle
3 months agoTheola
3 months agoEdwin
4 months agoLennie
4 months agoTresa
4 months agoLavonna
4 months agoVan
5 months agoVirgina
5 months agoRamonita
5 months agoNovella
5 months agoKristine
6 months agoRodrigo
6 months agoSusy
6 months agoDelbert
6 months agoBurma
7 months agoTeddy
7 months agoAdela
7 months agoEva
7 months agoDalene
8 months agoStephanie
8 months agoAliza
8 months agoJanella
8 months agoSommer
9 months agoYuette
9 months agoAnnalee
9 months agoAdela
10 months agoGerald
10 months agoAlline
12 months agoJoaquin
1 year agoJenelle
1 year agoGaston
1 year agoLeota
1 year agoVincent
1 year agoDewitt
1 year agoSimona
1 year agoSang
1 year agoNana
1 year agoStanford
1 year agoClare
1 year agoMaira
1 year agoJuliana
1 year agoTimothy
2 years agoYvonne
2 years agoTrina
2 years agoMarla
2 years agoPeggie
2 years agoYuki
2 years agoDerrick
2 years agoVincenza
2 years agoAmie
2 years agoAmber
2 years agoRosenda
2 years agoCarol
2 years agoThurman
2 years agoLino
2 years agoDerick
2 years agoJules
2 years agoCherri
2 years agoHillary
2 years agoIluminada
2 years agoAngelyn
2 years agoGlen
2 years agoQuinn
2 years agoRuby
2 years agoShonda
2 years agoWilliam
2 years agoLudivina
2 years agoTiera
2 years agoLore
2 years agoVal
2 years agoEva
2 years ago