
Free Preparation Discussions
 MENU
MENU
Salesforce Certified CRM Analytics and Einstein Discovery Consultant (Analytics-Con-201) Exam - Topic 4 Question 41 Discussion
Topic #: 4
A company wants to create a timeline chart to visualize the evolution of its Closed Won opportunities.
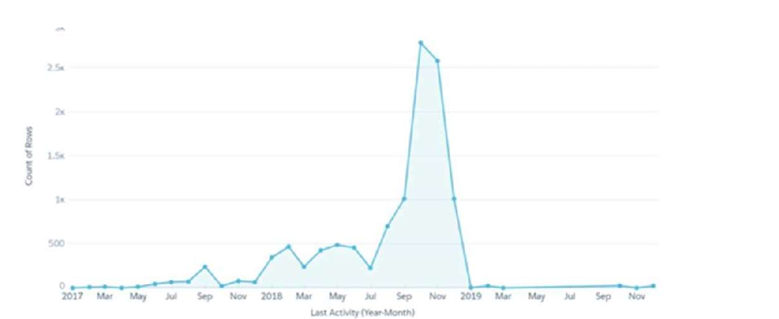
What are the required parameters to build a lens that displays output similar to the image shown?
To create a timeline chart similar to the one shown, the following parameters are typically required:
1 Measure: This could be the count of Closed Won opportunities or any other relevant metric that needs to be tracked over time.
1 Grouping by a Date Field: This is essential to plot the timeline effectively. The date field would typically be the close date of the opportunities.
Additional Groupings: Depending on the complexity and the detail needed, additional groupings can be added. For example, grouping by region or product line can provide more insights into the timeline. If trellis is used, it allows for the creation of multiple smaller charts within the main chart, each representing a slice of data based on the additional groupings.
This setup helps visualize the evolution of Closed Won opportunities over time, making it easy to spot trends, seasonal patterns, or other relevant insights.
Currently there are no comments in this discussion, be the first to comment!