Free Preparation Discussions
Free Salesforce Analytics-Con-301 Exam Dumps July 2026
Here you can find all the free questions related with Salesforce Certified Tableau Consultant (Analytics-Con-301) exam. You can also find on this page links to recently updated premium files with which you can practice for actual Salesforce Certified Tableau Consultant Exam. These premium versions are provided as Analytics-Con-301 exam practice tests, both as desktop software and browser based application, you can use whatever suits your style. Feel free to try the Salesforce Certified Tableau Consultant Exam premium files for free, Good luck with your Salesforce Certified Tableau Consultant Exam.MultipleChoice
A consultant is creating a dashboard to report on hourly sales data. The data should be refreshed hourly and is used for timely decision-making, so it is important to alert dashboard viewers when data has not been refreshed.
Which feature of Tableau Catalog should the consultant use to ensure dashboard viewers understand this message?
OptionsMultipleChoice
SIMULATION
From the desktop, open the CC workbook. Use the US Population Estimates data source.
You need to shape the data in US Population Estimates by using Tableau Desktop. The data must be formatted as shown in the following table.
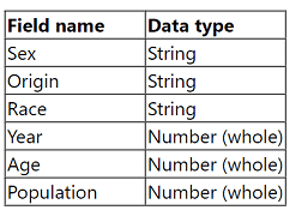
Open the Population worksheet. Enter the total number of records contained in the data set into the Total Records parameter.
From the File menu in Tableau Desktop, click Save.
OptionsMultipleChoice
SIMULATION
From the desktop, open the CC workbook.
Open the City Pareto worksheet.
You need to complete the Pareto chart to show the percentage of sales compared to the percentage of cities. The chart must show references lines to visualize how the data compares to the Pareto principle.
From the File menu in Tableau Desktop, click Save.
OptionsMultipleChoice
A company's Tableau Cloud admin wants to maintain control over what content gets published to its site for viewers, while also supporting self-service for dashboard creators.
Which governance strategy should the admin implement?
OptionsMultipleChoice
A transport and delivery company uses a command center dashboard in its logistics and distribution hubs. The dashboard is displayed on screens to show fleet movements, delivery status, and warehouse operations. The company needs the dashboard to provide up-to-date information without human intervention. The company's environment cannot access the internet, and the data source is configured to maintain a real-time connection.
How should the company meet this requirement?
OptionsMultipleChoice
A consultant has a view using a table calculation to calculate percent of total Sales by Category. The consultant would like to filter out particular categories, but wants the percent of total calculation to remain steady even as they filter items in or out.
What should the consultant do to achieve the desired impact?
OptionsMultipleChoice
SIMULATION
Refer to the exhibit.

From the desktop, open the NYC
Property Transactions workbook.
You need to record the performance of
the Property Transactions dashboard in
the NYC Property Transactions.twbx
workbook. Ensure that you start the
recording as soon as you open the
workbook. Open the Property
Transactions dashboard, reset the filters
on the dashboard to show all values, and
stop the recording. Save the recording in
C:\CC\Data\.
Create a new worksheet in the
performance recording. In the worksheet,
create a bar chart to show the elapsed
time of each command name by
worksheet, to show how each sheet in
the Property Transactions dashboard
contributes to the overall load time.
From the File menu in Tableau Desktop,
click Save. Save the performance
recording in C:\CC\Data\.
OptionsMultipleChoice
A client wants to flag orders that have sales higher than the regional average.
Which calculated field will produce the required result?
A.
[Sales]
>
{ FIXED [Order ID] : SUM([Sales]) }
Options