Free Preparation Discussions
Microsoft PL-300 Exam Questions
Free Microsoft PL-300 Exam Actual Questions
Note: Premium Questions for PL-300 were last updated On Jun. 06, 2026 (see below)
You have a Power B1 model that contains a table named Date. The table has the following columns.
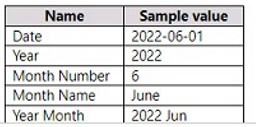
Answer is below.

In Power BI Desktop, you are creating a report that will contain three pages.
You need to create a custom tooltip page and prepare the page for use.
Which three actions should you perform? Each correct answer presents part of the solution.
You can create a custom tooltip page that shows more details about the selected category, such as this:
To create a custom tooltip page and prepare it for use, you need to perform these three actions34:
Add and configure visuals on the tooltip page. You can add any visuals, images, or other items that you want to show on the tooltip page. You can also format them as you like.
For the tooltip page, set Allow use as tooltip to On. This will enable Power BI to recognize this page as a tooltip page. You can also change the Page size to Tooltip to fit your content better.
For the target visual, set Tooltip type to Report page. This will allow you to select which report page you want to use as a custom tooltip for your visual. You can also filter your tooltip by fields from your target visual.
You have a BI dataset and a connected report.
You need to ensure that users can analyze data in Microsoft Excel by connecting directly to the dataset.
You grant the users the Build permission for dataset
What Should do next?
From Power 61 Desktop, you publish a new dataset and report lo a Power Bl workspace. The dataset has a row-level security (RLS) role named HR. You need to ensure that the HR team members have RLS applied when they view reports based on the dataset. What should you do?
- Select Question Types you want
- Set your Desired Pass Percentage
- Allocate Time (Hours : Minutes)
- Create Multiple Practice tests with Limited Questions
- Customer Support
Joseph Evans
12 days agoTimothy Lee
15 days agoHeather Green
1 month agoPatricia Stewart
2 months agoJeffrey Clark
1 month agoRonald Anderson
1 month agoSteven Evans
1 month agoJoshua Howard
2 months agoCrystal Rogers
29 days agoQuentin
2 months agoDana
3 months agoRashad
3 months agoPamella
3 months agoAhmed
3 months agoJimmie
4 months agoKara
4 months agoMica
4 months agoIndia
4 months agoBarbra
5 months agoHelga
5 months agoBrandon
5 months agoGeorgene
5 months agoAlbert
5 months agoLeonida
6 months agoDahlia
6 months agoPamella
6 months agoMa
6 months agoJina
7 months agoAnissa
7 months agoCeola
7 months agoJerry
8 months agoCoral
8 months agoMee
8 months agoFausto
8 months agoDorothea
8 months agoLuis
9 months agoMalinda
9 months agoHarrison
9 months agoTuyet
9 months agoAmber
9 months agoFelicidad
9 months agoLayla
11 months agoJeanice
11 months agoFrance
12 months agoLonna
1 year agoBronwyn
1 year agoFletcher
1 year agoDona
1 year agoGeorgiana
1 year agoHortencia
1 year agoJess
1 year agoCathrine
1 year agoAnnette
1 year agoYoulanda
1 year agoKristofer
1 year agoErasmo
1 year agoLezlie
1 year agoBrunilda
1 year agoAlise
1 year agoLaura
1 year agoMiesha
1 year agoCornell
1 year agoShanice
2 years agoRosalia
2 years agoShalon
2 years agoCallie
2 years agoLaine
2 years agoFlo
2 years agoCassi
2 years agoRonnie
2 years agoDahlia
2 years agoMillie
2 years agoGretchen
2 years agoTegan
2 years agoElza
2 years agoJani
2 years agoDana
2 years agoKarima
2 years agoMel
2 years agoMatthew
2 years agoSamuel
2 years agoNell
2 years agoAlberta
2 years agoChantay
2 years agoAileen
2 years agoDenae
2 years agoLeatha
2 years agoalezza
2 years agoshelisha
2 years agoelishaa
2 years agokallis
2 years agoAdria
2 years ago