Deal of The Day! Hurry Up, Grab the Special Discount - Save 25% - Ends In 00:00:00 Coupon code: SAVE25
Free Preparation Discussions
Microsoft DP-900 Exam - Topic 4 Question 42 Discussion
Actual exam question for
Microsoft's
DP-900 exam
Question #: 42
Topic #: 4
[All DP-900 Questions]
Topic #: 4
You need to create a visualization of running sales totals per quarter as shown in the following exhibit.
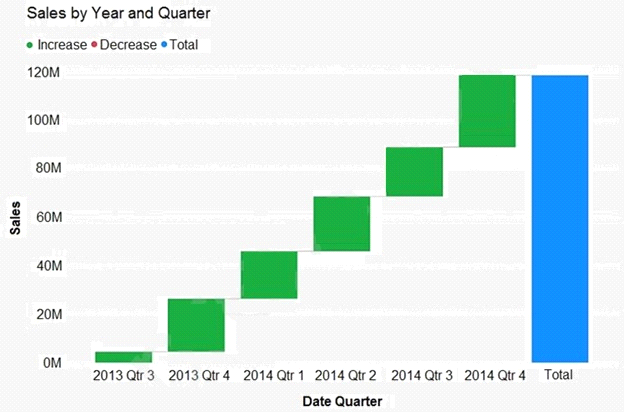
What should you create in Power BI Desktop?
Carlota
9 months agoReuben
9 months agoDorthy
9 months agoCaitlin
9 months agoElfrieda
9 months agoPura
9 months agoAlba
10 months agoCatarina
10 months agoWilda
10 months agoLilli
10 months agoIra
10 months agoMadonna
10 months ago