Free Preparation Discussions
Microsoft Exam 77-427 Topic 9 Question 42 Discussion
Topic #: 9
You work as an Office Assistant for Tech Perfect Inc. The company has a Windows-based network. You are creating a business report by using. Microsoft Excel 2013. You have arranged sales data as shown below:
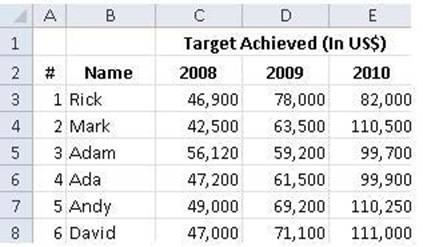
You want to provide pictorial representation of the trend of the sales data in front of each row.
Which of the following actions will you take to accomplish the task with the least amount of administrative burden?
In order to accomplish the task with the least amount of administrative burden, use sparklines. Sparklines, introduced in Microsoft Office 2013, are tiny charts that can fit in a cell. The sparklines can be used to show trends in a small amount of space. The sparklines visually summarize trends alongside data. The sparklines can be added through the Insert tab. Answer option A is incorrect. Stand-alone slicers are referenced from Online Analytical Processing (OLAP) Cube functions. These stand-alone slicers can be connected with any PivotTable in future. They can be added by using the slicer button on the Ribbon. They need to be manually linked into grids as required. Answer option B is incorrect. A form control is an original control that is compatible with old versions of Excel, beginning with Excel version 5. 0. It is designed for use on XLM macro sheets. It can be used when a user wants to simply interact with cell data without using VBA code and when he wants to add controls to chart sheets. By using form controls, the user can run macros. He can attach an existing macro to a control, or write or record a new macro. These controls cannot be added to UserForms, used to control events, or modified to run Web scripts on Web pages. Answer option D is incorrect. A PivotTable report is used to summarize large amounts of data, to analyze numerical data, and to answer unexpected questions about data.
Currently there are no comments in this discussion, be the first to comment!