Deal of The Day! Hurry Up, Grab the Special Discount - Save 25% - Ends In 00:00:00 Coupon code: SAVE25
Free Preparation Discussions
Microsoft Exam 77-427 Topic 3 Question 2 Discussion
Actual exam question for
Microsoft's
exam
Question #: 2
Topic #: 3
[All Questions]
Topic #: 3
You work as an Office Assistant for Media Perfect Inc. You are creating a report in Microsoft Excel 2013. The report worksheet will include the sales made by all the sales managers in the month of January.
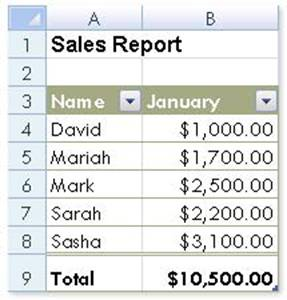
In the worksheet, you are required to place a pictorial representation displaying the percentage of total sales made by each sales manager in January. Which of the following charts will you use to accomplish the task?
Suggested Answer:
D
In order to accomplish the task, you will have to insert a pie chart in the worksheet. Excel provides a pie chart facility to display data that is arranged in one column or row on a worksheet. Pie charts display the size of items in one data series, proportional to the sum of the items.
Currently there are no comments in this discussion, be the first to comment!