Free Microsoft DA-100 Exam Dumps
Here you can find all the free questions related with Microsoft Analyzing Data with Microsoft Power BI (DA-100) exam. You can also find on this page links to recently updated premium files with which you can practice for actual Microsoft Analyzing Data with Microsoft Power BI Exam. These premium versions are provided as DA-100 exam practice tests, both as desktop software and browser based application, you can use whatever suits your style. Feel free to try the Analyzing Data with Microsoft Power BI Exam premium files for free, Good luck with your Microsoft Analyzing Data with Microsoft Power BI Exam.FillInTheBlank
You need to create a relationship in the dataset for RLS.
What should you do? To answer select the appropriate options in the answer area.
NOTE: Each correct selection is worth one point.

Explanation.
Answer as below

FillInTheBlank
You need to create a measure that will return the percentage of late orders.
How should you complete the DAX expression? To answer, select the appropriate options in the answer area.
NOTE: Each correct selection is worth one point.

Explanation.
Answer as below

MultipleChoice
You have a line chart that shows the number of employees in a department over time.
You need to see the total salary costs of the employees when you hover over a data point.
What are two possible ways to achieve this goal? Each correct answer presents a complete solution.
NOTE: Each correct selection is worth one point.
OptionsDragDrop
DROP
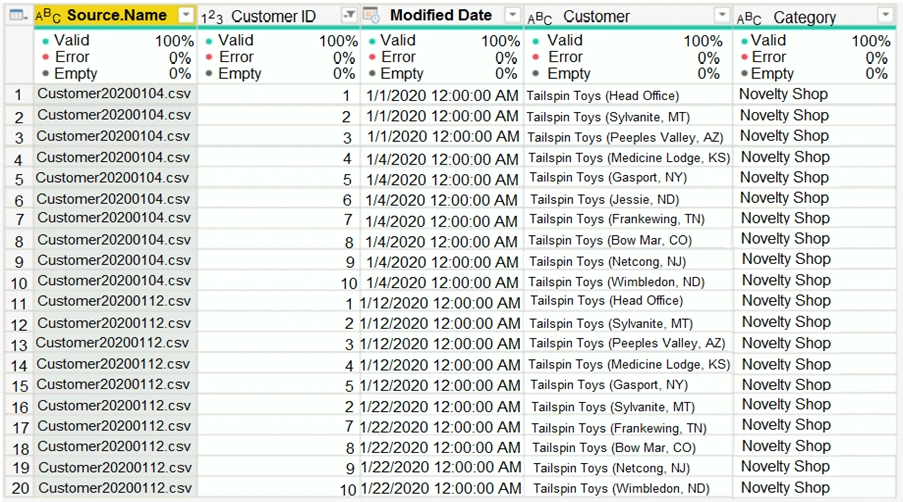
You have a query named Customer that imports CSV files from a data lake. The query contains 500 rows as shown in the exhibit. (Click the Exhibit tab.)


Each file contains deltas of any new or modified rows from each load to the data lake. Multiple files can have the same customer ID.
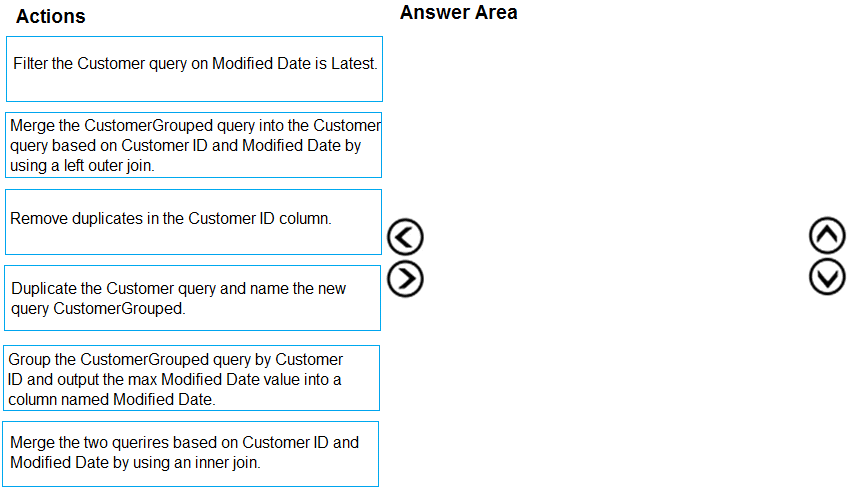
You need to keep only the last modified row for each customer ID.
Which three actions should you perform in sequence? To answer, move the appropriate actions from the list of actions to the answer area and arrange them in the correct order.


MultipleChoice
You are configuring a Microsoft Power Bl data model to enable users to ask natural language questions by using Q&A. You have a table named Customer that has the following measure.
Customer Count = DISTINCTCOUNT(Customer[CustomerID])
Users frequently refer to customers as subscribers.
You need to ensure that the users can get a useful result for "subscriber count" by using Q&A. The solution must minimize the size of the model.
What should you do?
OptionsHotspot
You are creating a Microsoft Power Bl imported data model to perform basket analysis. The goal of the analysis is to identify which products are usually bought together in the same transaction across and within sales territories.
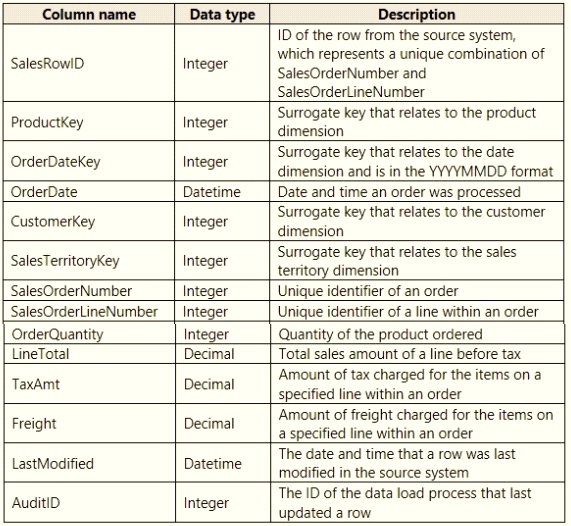
You import a fact table named Sales as shown in the exhibit. (Click the Exhibit tab.)

The related dimension tables are imported into the model.
Sales contains the data shown in the following table.

DragDrop
You receive revenue data that must be included in Microsoft Power Bl reports.
You perform an initial load of the data from a Microsoft Excel source as shown in the following exhibit.


You plan to create several visuals from the data, including a visual that shows revenue split by year and product.
You need to transform the data to ensure that you can build the visuals. The solution must ensure that the columns are named appropriately for the data that they contain.


