Free Preparation Discussions
Fortinet NSE4_FGT_AD-7.6 Exam - Topic 4 Question 8 Discussion
Topic #: 4
Refer to the exhibit.
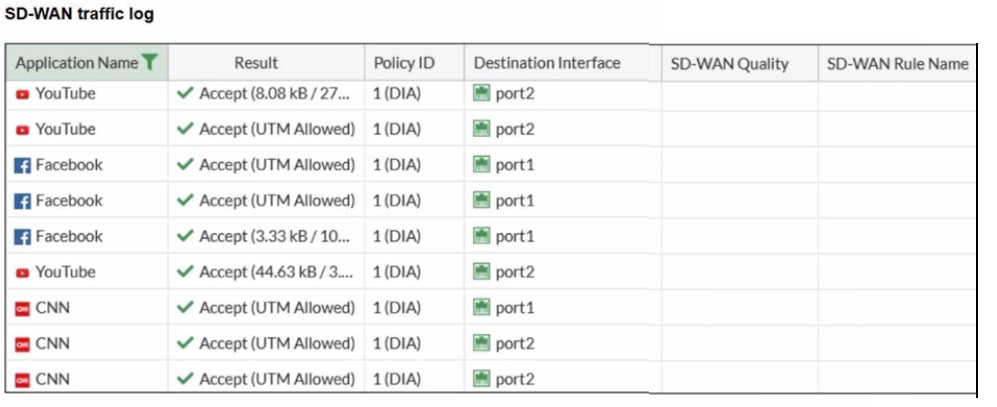
The administrator configured SD-WAN rules and set the FortiGate traffic log page to display SD-WAN-specific columns: SD-WAN Quality and SD-WAN Rule Name
FortiGate allows the traffic according to policy ID 1 placed at the top. This is the policy that allows SD-WAN traffic. Despite these settings, the traffic logs do not show the name of the SD-WAN rule used to steer those traffic flows
What could be the reason?
In FortiOS 7.6, SD-WAN steering decisions are recorded in traffic logs only when traffic matches an explicit SD-WAN rule (SD-WAN service rule). When no configured SD-WAN rule matches a session, FortiGate uses the implicit (default) SD-WAN rule/behavior to select a member (often resulting in load-balancing or default selection based on the configured SD-WAN algorithm).
In the exhibit, traffic is permitted by firewall policy ID 1, and the Destination Interface alternates between port1 and port2, but SD-WAN Rule Name remains empty. This is consistent with the sessions being forwarded by the implicit SD-WAN rule, which does not populate a named rule in the log columns.
Why the other options are not correct:
A: SD-WAN rule name logging is not a ''delayed display'' behavior requiring refresh; it is populated per-session when an explicit rule matches.
B: Application Control is not required for SD-WAN rule name to appear. Rule name logging depends on SD-WAN rule match, not on whether Application Control is enabled.
C: Feature visibility affects GUI display options, but the exhibit already shows the SD-WAN columns enabled; the issue is that no explicit SD-WAN rule is being hit.
Donte
3 hours agoFrank
5 days agoRasheeda
10 days agoIvette
16 days agoLilli
2 months agoAyesha
2 months agoIlda
3 months agoSalena
3 months agoHelaine
3 months agoBulah
3 months ago