
Free Preparation Discussions
 MENU
MENU
CrowdStrike CCFH-202b Exam Questions
- Topic 1: ATT&CK Frameworks: This domain covers understanding the cyber kill chain and using the MITRE ATT&CK Framework to model threat actor behaviors and communicate findings to non-technical audiences.
- Topic 2: Detection Analysis: This domain focuses on analyzing Host and Process Timelines in Falcon to understand events and detections, and pivoting to additional investigative tools.
- Topic 3: Search and Investigation Tools: This domain covers analyzing file and process metadata, using Investigate Module tools, performing various searches, and interpreting dashboard results.
- Topic 4: Event Search: This domain focuses on using CrowdStrike Query Language to build queries, format and filter event data, understand process relationships and event types, and create custom dashboards.
- Topic 5: Reports and References: This domain covers using built-in Hunt and Visibility reports and leveraging Events Full Reference documentation for event information.
- Topic 6: Hunting Analytics: This domain focuses on recognizing malicious behaviors, evaluating information reliability, decoding command line activity, identifying infection patterns, distinguishing legitimate from adversary activity, and identifying exploited vulnerabilities.
- Topic 7: Hunting Methodology: This domain covers conducting active hunts, performing outlier analysis, testing hunting hypotheses, constructing queries, and investigating process trees.
Free CrowdStrike CCFH-202b Exam Actual Questions
Note: Premium Questions for CCFH-202b were last updated On Sep. 01, 2026 (see below)
Which of the following is a suspicious process behavior?
Non-network processes are processes that are not expected to communicate over the network, such as notepad.exe. If they make an outbound network connection, it could indicate that they are compromised or maliciously used by an adversary. PowerShell running an execution policy of RemoteSigned is a default setting that allows local scripts to run without digital signatures. An Internet browser performing multiple DNS requests is a normal behavior for web browsing. PowerShell launching a PowerShell script is also a common behavior for legitimate tasks.
Refer to Exhibit.
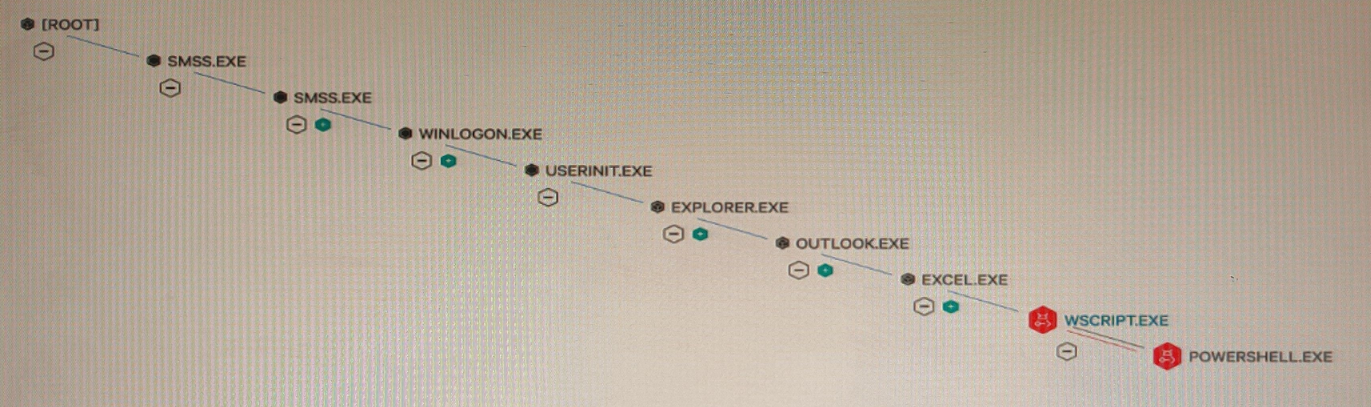
What type of attack would this process tree indicate?
This process tree indicates a phishing attack, as it shows a user opening an email attachment (outlook.exe) that launches a malicious macro (cmd.exe) that downloads and executes a payload (powershell.exe) that connects to a remote server (svchost.exe). A phishing attack is a type of social engineering attack that uses deceptive emails or messages to trick users into opening malicious attachments or links that can compromise their systems or credentials.
You want to produce a list of all event occurrences along with selected fields such as the full path, time, username etc. Which command would be the appropriate choice?
The table command is used to produce a list of all event occurrences along with selected fields such as the full path, time, username etc. It takes one or more field names as arguments and displays them in a tabular format. The fields command is used to keep or remove fields from search results, not to display them in a list. The distinct_count command is used to count the number of distinct values of a field, not to display them in a list. The values command is used to display a list of unique values of a field within each group, not to display all event occurrences.
What elements are required to properly execute a Process Timeline?
The Agent ID (AID) and the Target Process ID are the elements that are required to properly execute a Process Timeline. The Agent ID (AID) is a unique identifier for each host that has a Falcon sensor installed. The Target Process ID is the decimal representation of the process identifier for the process that you want to investigate. These two elements are used to query the cloud for the events related to the process on the host. The Agent ID (AID) only, the Hostname and Local Process ID, and the Target Process ID only are not sufficient to execute a Process Timeline.
Where would an analyst find information about shells spawned by root, Kernel Module loads, and wget/curl usage?
The Linux Sensor report is where an analyst would find information about shells spawned by root, Kernel Module loads, and wget/curl usage. The Linux Sensor report is a pre-defined report that provides a summary view of selected activities on Linux hosts. It shows information such as process execution events, network connection events, file write events, etc. that occurred on Linux hosts within a specified time range. The Sensor Health report, the Sensor Policy Daily report, and the Mac Sensor report do not provide the same information.
- Select Question Types you want
- Set your Desired Pass Percentage
- Allocate Time (Hours : Minutes)
- Create Multiple Practice tests with Limited Questions
- Customer Support
Karen Bell
17 days agoSarah Anderson
1 month agoRichard Adams
2 months agoSandra Smith
2 months agoCharles Murphy
3 months agoMargaret Clark
3 months agoNathan Murphy
4 months agoRobert Green
4 months agoMichelle Gonzalez
5 months agoJessica Thomas
4 months agoNathan Jones
4 months agoEmma Anderson
4 months agoEmma Stewart
4 months agoAllene
5 months agoEdna
6 months agoJame
6 months agoNelida
6 months agoMargo
6 months agoAudry
7 months agoFrank
7 months agoLaura
7 months agoAnika
7 months agoLennie
8 months agoGarry
8 months agoAntonette
8 months ago