
Free Preparation Discussions
 MENU

CompTIA DY0-001 Exam Questions
Free CompTIA DY0-001 Exam Actual Questions
Note: Premium Questions for DY0-001 were last updated On Oct. 19, 2026 (see below)
Which of the following distribution methods or models can most effectively represent the actual arrival times of a bus that runs on an hourly schedule?
Scheduled buses tend to arrive around a fixed time with random delays that cluster symmetrically around the hour. A normal distribution effectively models those continuous, bell-shaped deviations from the exact schedule.
SIMULATION
A data scientist needs to determine whether product sales are impacted by other contributing factors. The client has provided the data scientist with sales and other variables in the data set.
The data scientist decides to test potential models that include other information.
INSTRUCTIONS
Part 1
Use the information provided in the table to select the appropriate regression model.
Part 2
Review the summary output and variable table to determine which variable is statistically significant.
If at any time you would like to bring back the initial state of the simulation, please click the Reset All button.
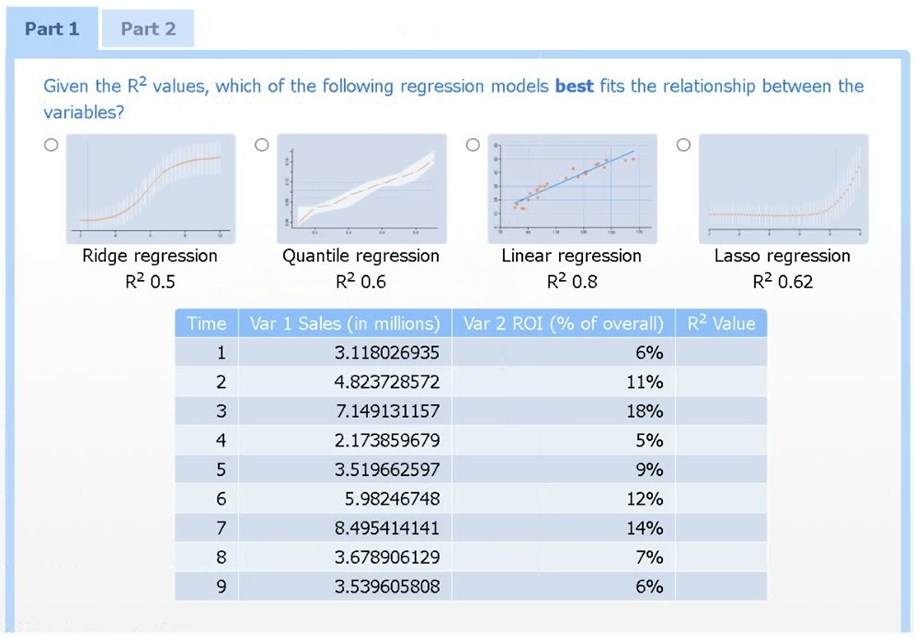
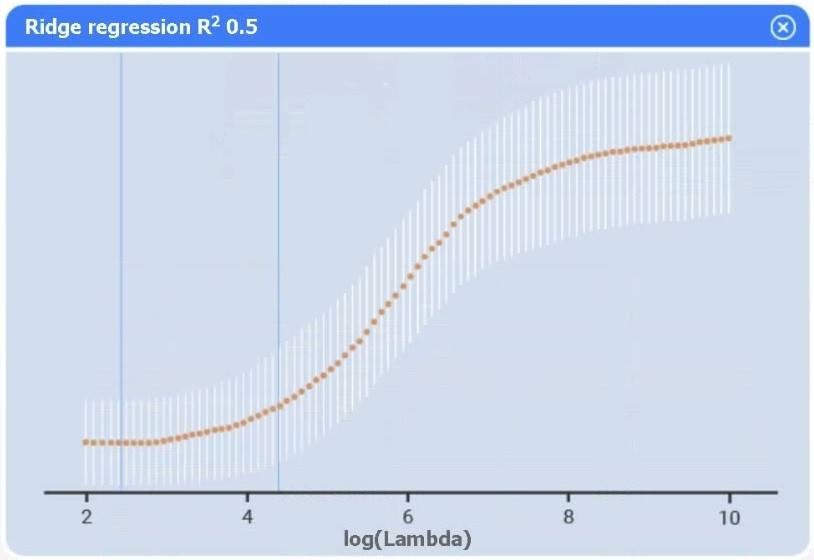
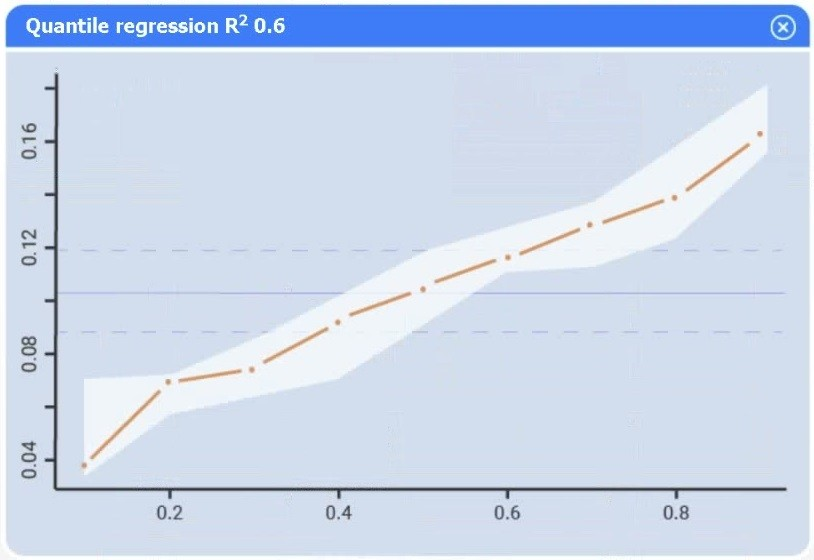
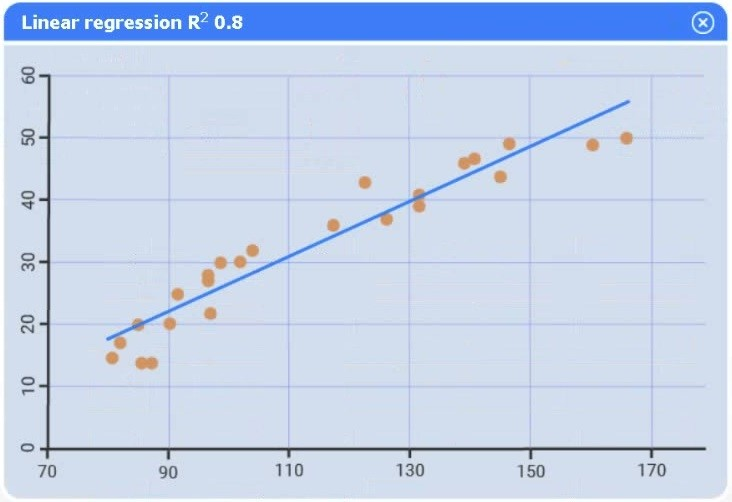
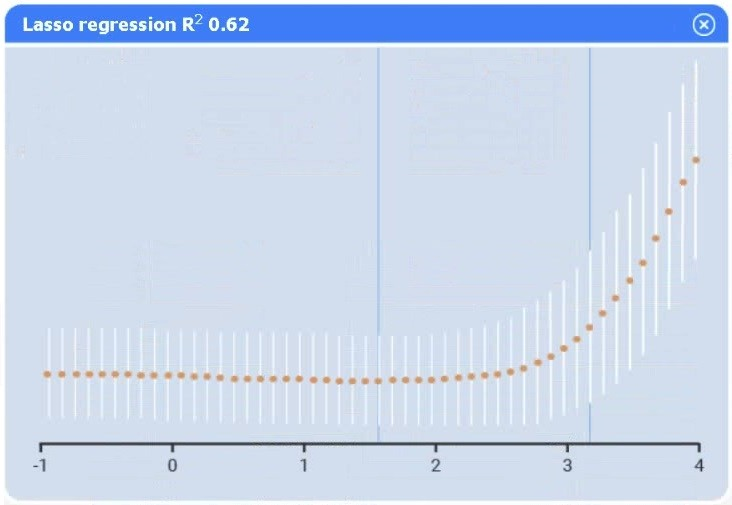


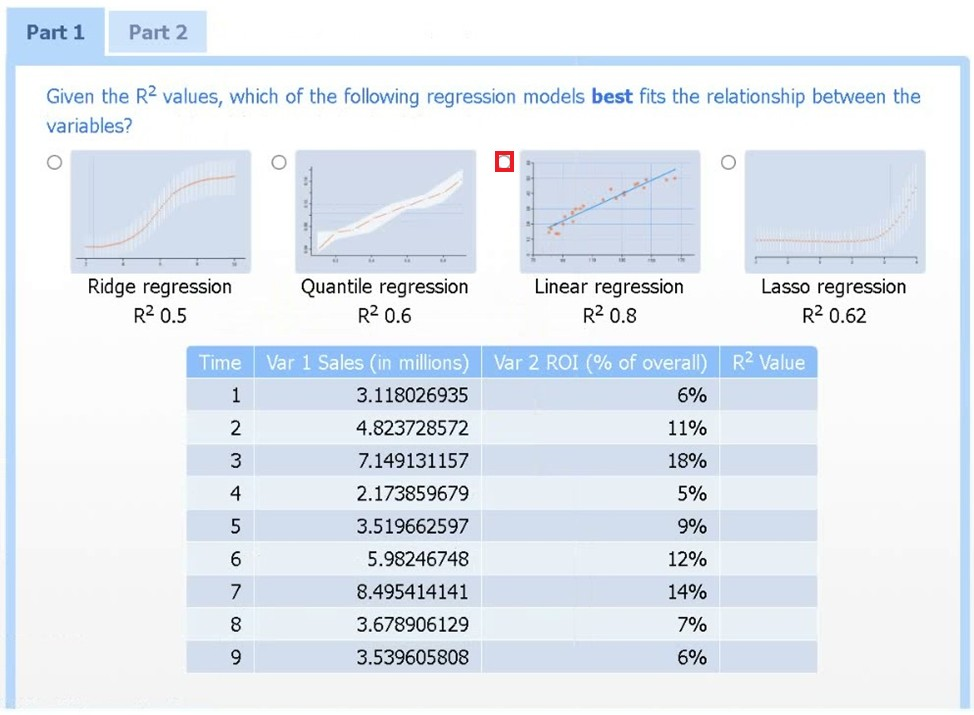
Part 1
Linear regression.
Of the four models, linear regression has the highest R (0.8), indicating it explains the greatest proportion of variance in sales.
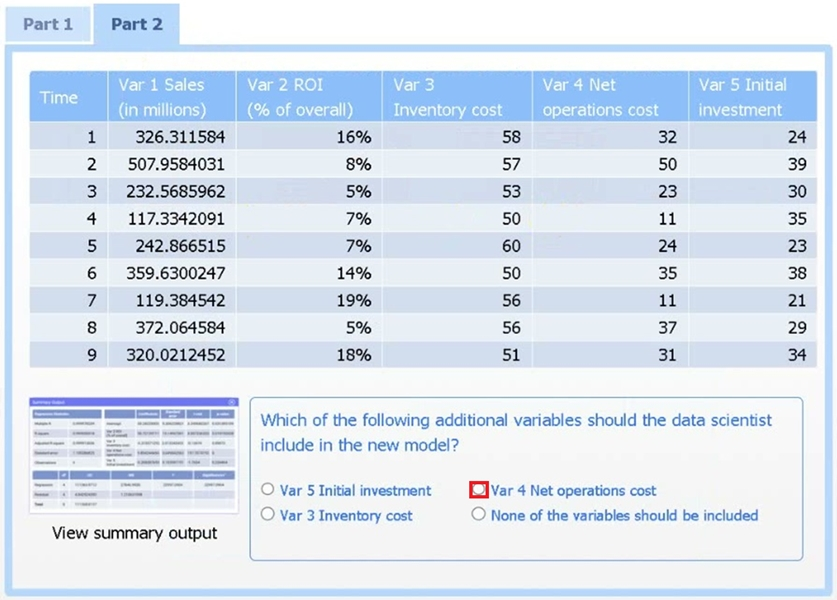
Part 2
Var 4 -- Net operations cost.
Net operations cost has a p-value of essentially 0 (far below 0.05), indicating it is the only additional predictor statistically significant in explaining sales. Neither inventory cost (p0.90) nor initial investment (p0.23) reach significance.
Which of the following issues should a data scientist be most concerned about when generating a synthetic data set?
If synthetic data don't accurately mirror the real-world distributions and relationships, any models trained on them will perform poorly in deployment. Representativeness is the critical concern when generating synthetic data.
A data scientist needs to analyze a company's chemical businesses and is using the master database of the conglomerate company. Nothing in the data differentiates the data observations for the different businesses. Which of the following is the most efficient way to identify the chemical businesses' observations?
Engaging the business team leverages domain expertise to pinpoint which records pertain to chemical operations, allowing you to extract and analyze just the relevant subset. This avoids the time and resource waste of ingesting and sifting through unrelated data.
Which of the following distance metrics for KNN is best described as a straight line?
Euclidean distance measures the straight-line distance between two points in space, matching the geometric ''as-the-crow-flies'' notion of distance.
- Select Question Types you want
- Set your Desired Pass Percentage
- Allocate Time (Hours : Minutes)
- Create Multiple Practice tests with Limited Questions
- Customer Support
Jennifer Phillips
29 days agoGeorge Moore
1 month agoDennis Brown
2 months agoBarbara Cooper
3 months agoBrenda Green
3 months agoCharles Moore
4 months agoAngela Nguyen
4 months agoRonald Lee
5 months agoRachel Harris
5 months agoMaria Miller
6 months agoKenneth Walker
6 months agoPatricia White
6 months agoJeffrey Wright
6 months agoSteven Lopez
6 months agoDeborah Williams
6 months agoMelissa Jackson
5 months agoGladys
7 months agoWilford
7 months agoThersa
7 months agoMerissa
7 months agoBeata
8 months agoJessenia
8 months agoIsadora
8 months agoMelodie
8 months agoMarica
9 months agoAlida
9 months agoSamuel
9 months agoDavida
9 months agoCarlee
10 months agoBroderick
10 months agoFernanda
10 months agoStevie
10 months agoMagnolia
11 months agoHermila
11 months agoLuke
11 months agoJohnetta
11 months agoRosio
12 months agoEmerson
12 months agoEstrella
1 year agoCarlee
1 year agoLon
1 year agoDeonna
1 year agoLeonie
1 year agoSherill
1 year agoMarya
1 year agoHollis
1 year agoNiesha
1 year agoRosita
1 year agoVicki
1 year agoTasia
1 year agoHarrison
1 year agoReyes
1 year agoMatt
1 year agoKelvin
1 year ago