
Free Preparation Discussions
 MENU
MENU
Cisco 300-445 Exam Questions
- Cisco Certified Network Professional CCNP Certifications
- Cisco Certified Network Professional Enterprise CCNP Enterprise Certifications
- Topic 1: Platforms and Architecture: This domain covers understanding monitoring agent types and placement, active versus passive monitoring, and ThousandEyes WAN Insights. It addresses Cisco platform integrations, metric baselines, and selecting appropriate integration methods and assurance platforms based on business requirements.
- Topic 2: Data Collection Implementation: This domain focuses on deploying enterprise and endpoint agents across infrastructure and end-user devices. It covers configuring network, DNS, voice, web, and endpoint tests using ThousandEyes and Meraki Insights, along with implementing synthetic web tests and authentication methods.
- Topic 3: Data Analysis: This domain encompasses diagnosing network issues like packet loss, congestion, routing, and jitter, plus end-device problems. It includes analyzing web application performance and identifying security threats such as DDoS attacks, DNS hijacking, and BGP hijacking.
- Topic 4: Insights and Alerts: This domain addresses configuring alert rules based on network conditions and end-user experience factors. It covers selecting metrics for stakeholders, validating alerts, and recommending network optimization for capacity planning.
Free Cisco 300-445 Exam Actual Questions
Note: Premium Questions for 300-445 were last updated On Oct. 12, 2026 (see below)
A network engineer is investigating widespread reports of poor performance for a data center-hosted web application. Which ThousandEyes agent type would be most effective for quickly identifying the root cause?
According to the Designing and Implementing Enterprise Network Assurance (300-445 ENNA) guidelines, troubleshooting widespread performance issues for a public or data center-hosted app17lication requires an 'outside-in' perspective. When reports are widespread,18 the goal is to determine if the issue is global, regional, or specific to certain ISP paths leading to the data center.
The Cloud Agent (Option D) is the most effective tool for this task because these agents are maintained by Cisco ThousandEyes in over 240+ locations worldwide within Tier 1, 2, and 3 ISPs and cloud provider regions.19 Because they are pre-deployed and immediately available, a network engineer can instantly run tests from multiple global locations toward the data center-hosted application without having to install any software or manage any infrastructure. This allows the engineer to quickly compare performance metrics (latency, loss, and page load times) across different geographies. If Cloud Agents in London report no issues while those in New York report high packet loss, the engineer can immediately pinpoint the root cause as a regional ISP or peering issue rather than a failure within the data center itself.
Enterprise Agent (Option B): While these could be used if they were already installed in various branch offices, they require ownership of the infrastructure and deployment time. They are better suited for 'inside-out' monitoring.
Endpoint Agent (Option C): These are useful for troubleshooting individual user experience but are not the 'quickest' way to baseline global performance against a data center application during a widespread event.
Synthetic Agent (Option A): As noted previously, this is a generic term describing the underlying technology used by all ThousandEyes agent types.
Therefore, Cloud Agents provide the necessary breadth and immediate availability to perform rapid root cause analysis for widespread application performance issues.
ThousandEyes offers several native integrations for receiving instant event notifications triggered by alerts. Which of the following integrations are available directly within the ThousandEyes platform? Select all that apply.
According to the Designing and Implementing Enterprise Network Assurance (300-445 ENNA) architecture, ThousandEyes provides a suite of native, 'out-of-the-box' integrations specifically designed for alert notifications. These integrations are configured via the Manage > Integrations or Alert Rules > Notifications tabs and allow the platform to push instant event data to a variety of collaboration, IT operations, and observability tools.
The verified list of native notification integrations includes:
ServiceNow (A): Facilitates direct incident management and automated ticketing workflows.
PagerDuty (B): Allows for automated incident escalation and on-call routing based on ThousandEyes alerts.
MS Teams (C) & Slack (H): Enable real-time chatops by pushing alert details and permalinks directly into specified channels for team collaboration.
Splunk (D): Utilizes the Cisco ThousandEyes App for Splunk to ingest alert data for historical analysis and correlation within a SIEM or logging platform.
AppDynamics (F): Sends alert notifications directly into an AppDynamics instance, allowing application owners to correlate network issues with APM metrics.12
Webex (G): Integrates with the Webex Control Hub and specific Webex spaces to provide unified visibility for collaboration performance.34
AWS (Option E) is not a native alert notification destination 5in this context; instead, ThousandEyes integrates with AWS for 'Cloud Insights' (ingesting VPC Flow Logs) and 'Test Recommendations' rather than acting as a receiver for event notifications like a chat or ITSM tool. By utilizing these native integrations, enterprise teams ensure that the right stakeholders are notified through their preferred communication channels the moment a performance threshold is breached, drastically improving response times across the organization.
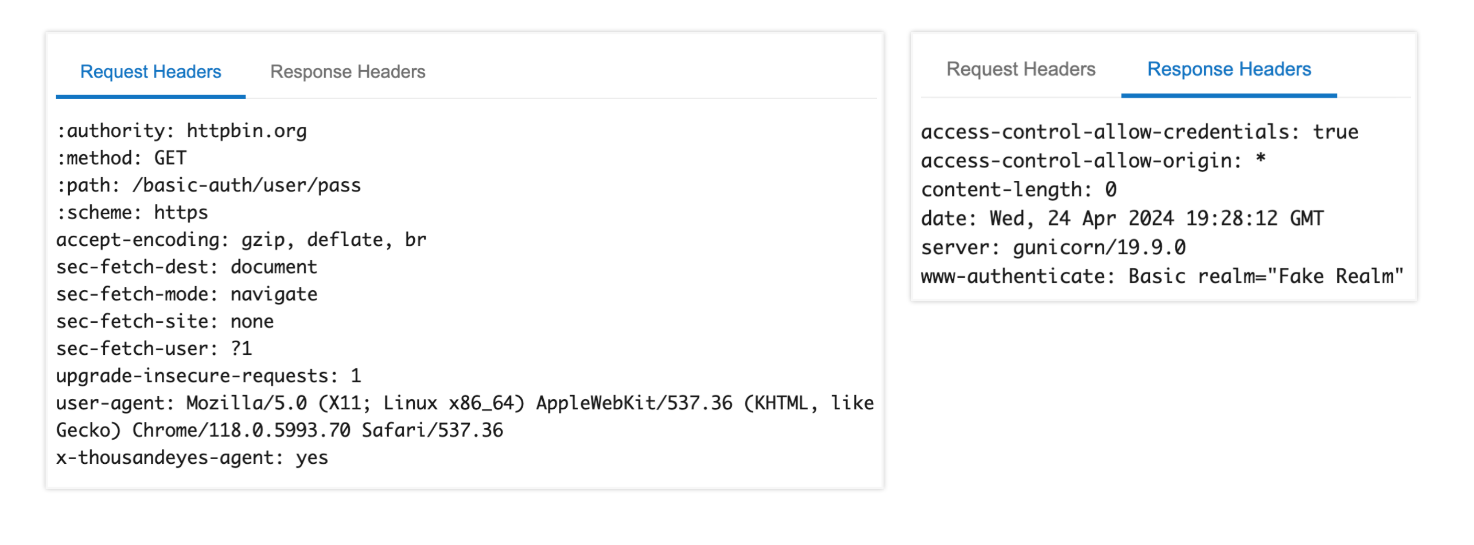
Review the exhibits. Based on the evidence, which action is most likely to solve the issue?

The following exhibit shows the Capacity Planning results for a router interface connected to an ISP, which provides a 1Gbps connection. Based on the evidence, which action is most likely to fix the observed behavior?
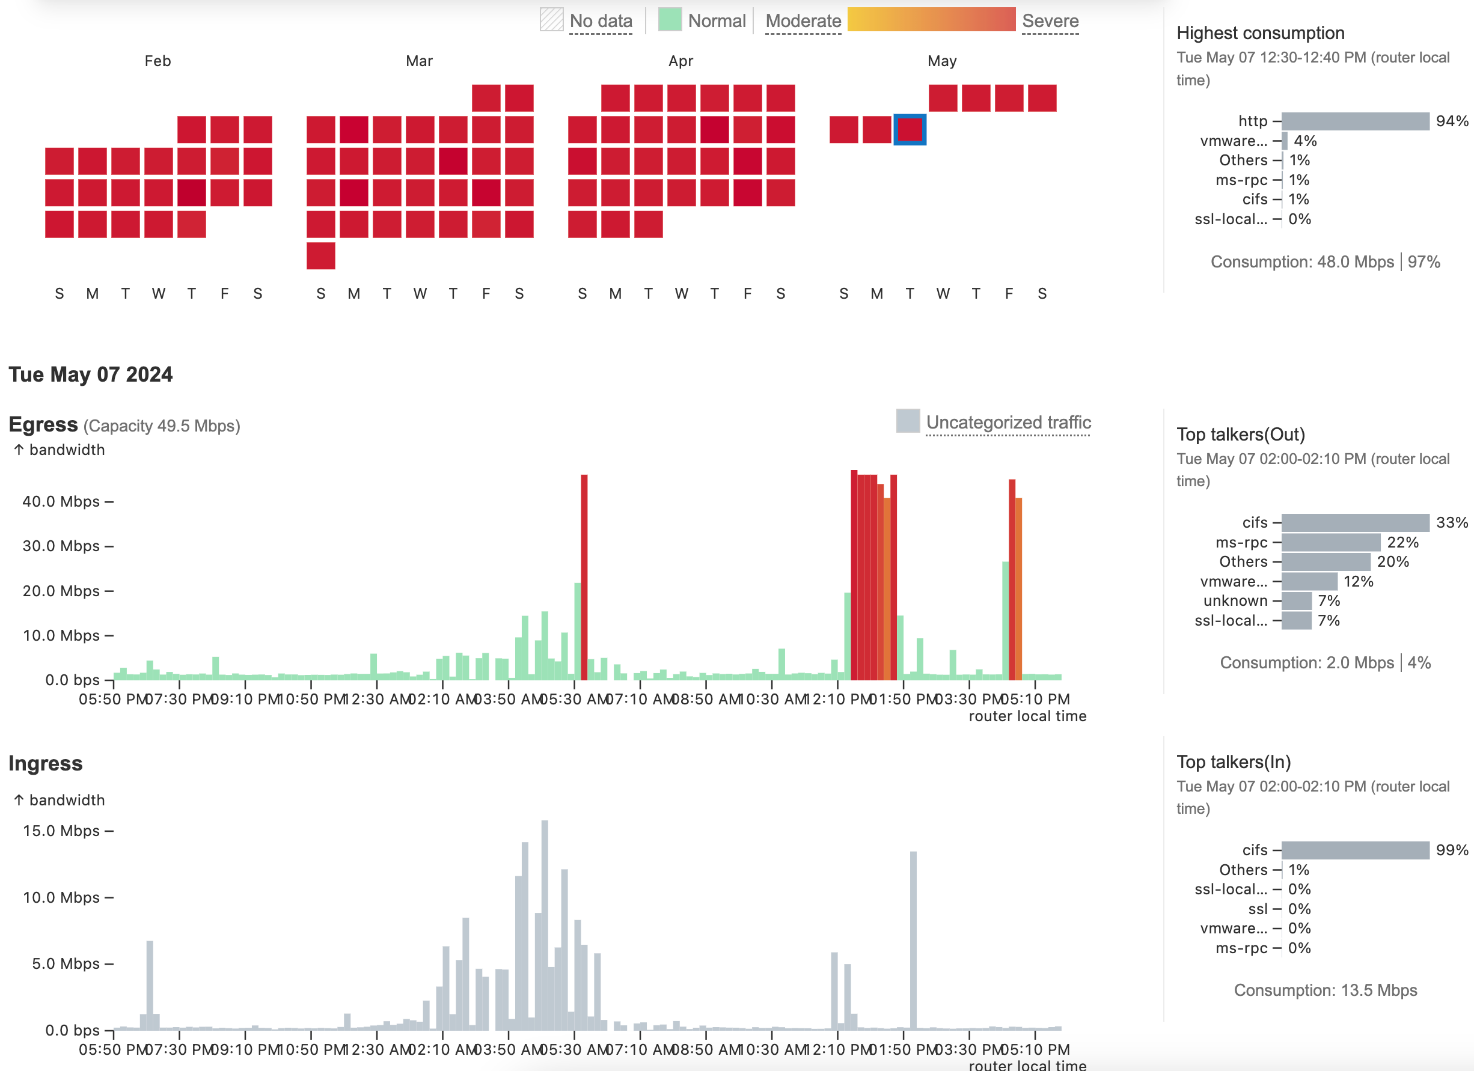
In the context of Designing and Implementing Enterprise Network Assurance (300-445 ENNA), capacity planning requires accurate baselining of interface bandwidth against its theoretical and provisioned limits. Analyzing Exhibit 4.5 Question 4 (image_79d4fc.jpg) reveals a significant discrepancy between the physical reality of the link and its configuration within the monitoring tool.
The exhibit displays a capacity planning dashboard with a calendar heatmap and traffic graphs. The heatmap for February through May shows a high frequency of 'Severe' (red) utilization blocks. Looking at the Egress graph for Tue May 07 2024, the traffic spikes clearly exceed 40.0 Mbps. Crucially, the dashboard indicates an 'Egress Capacity' of 49.5 Mbps and reports that the 'Highest consumption' was 48.0 Mbps, representing 97% of the available bandwidth.
However, the question states that the ISP provides a 1 Gbps (1000 Mbps) connection. Since the actual traffic being sent is less than 50 Mbps, the link is nowhere near physical saturation. The 'Severe' alerts and high utilization percentages are occurring only because the monitoring software (likely ThousandEyes or a similar NMS) is configured with a Maximum Capacity of only 49.5 Mbps for this interface. This misconfiguration causes the tool to calculate utilization based on a much smaller 'pipe' than what actually exists, leading to false-positive alerts.
Therefore, the most likely action to fix this observed behavior is to reconfigure maximum capacity for the interface (Option B) to match the 1 Gbps specification.
Option A is unnecessary because the current link is only being utilized at ~5% of its 1 Gbps potential.
Option C is a restrictive policy change that is not justified given the actual available headroom.
Option D might shift how data is displayed but will not fix the underlying mathematical error in utilization calculations.
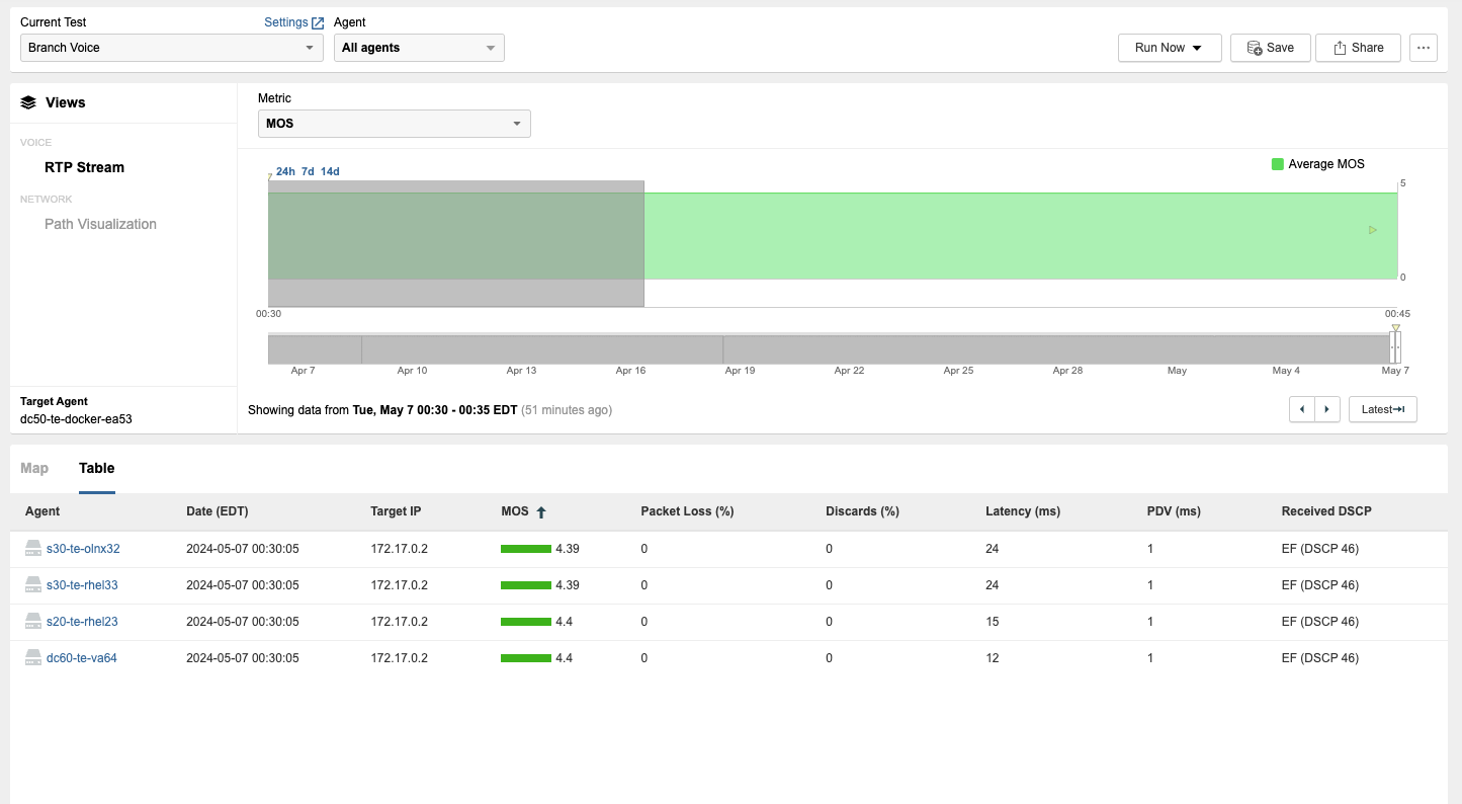
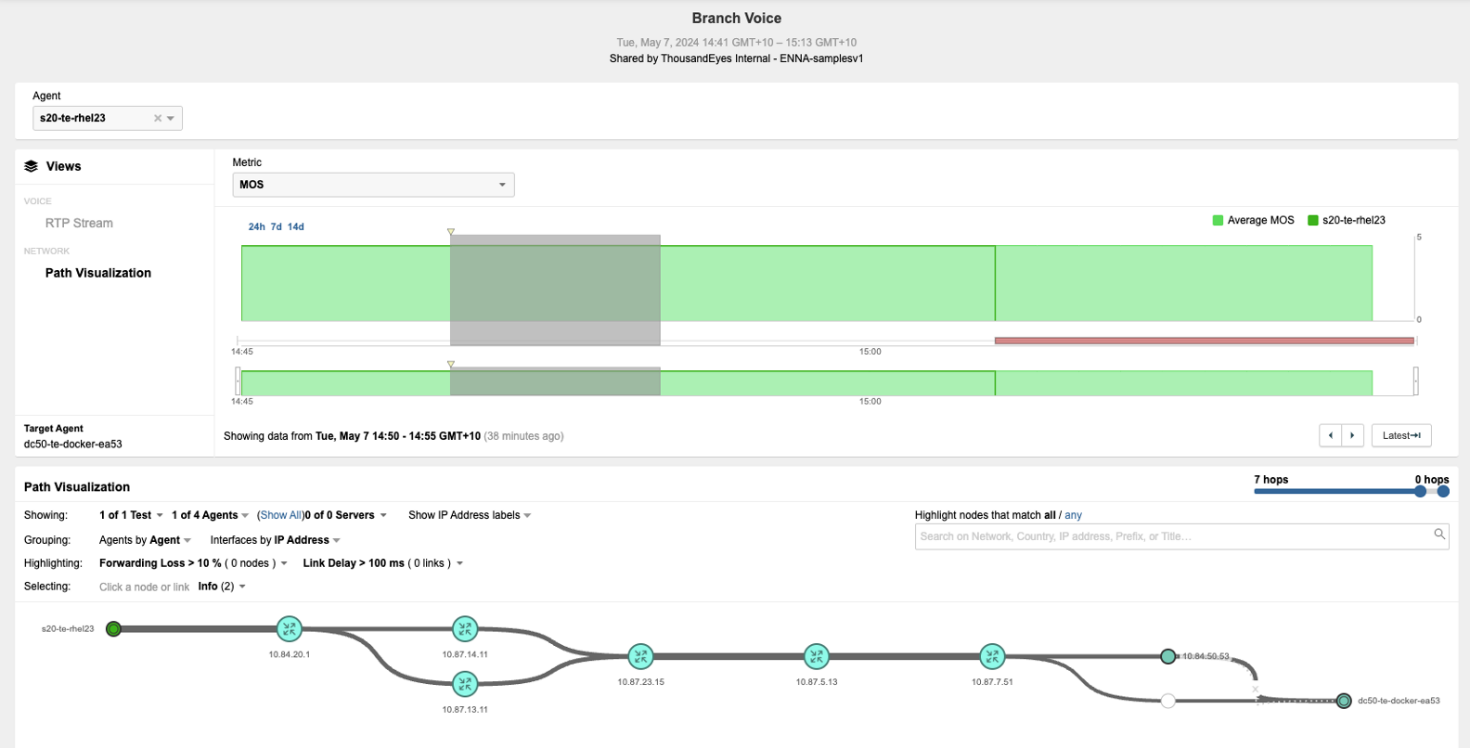
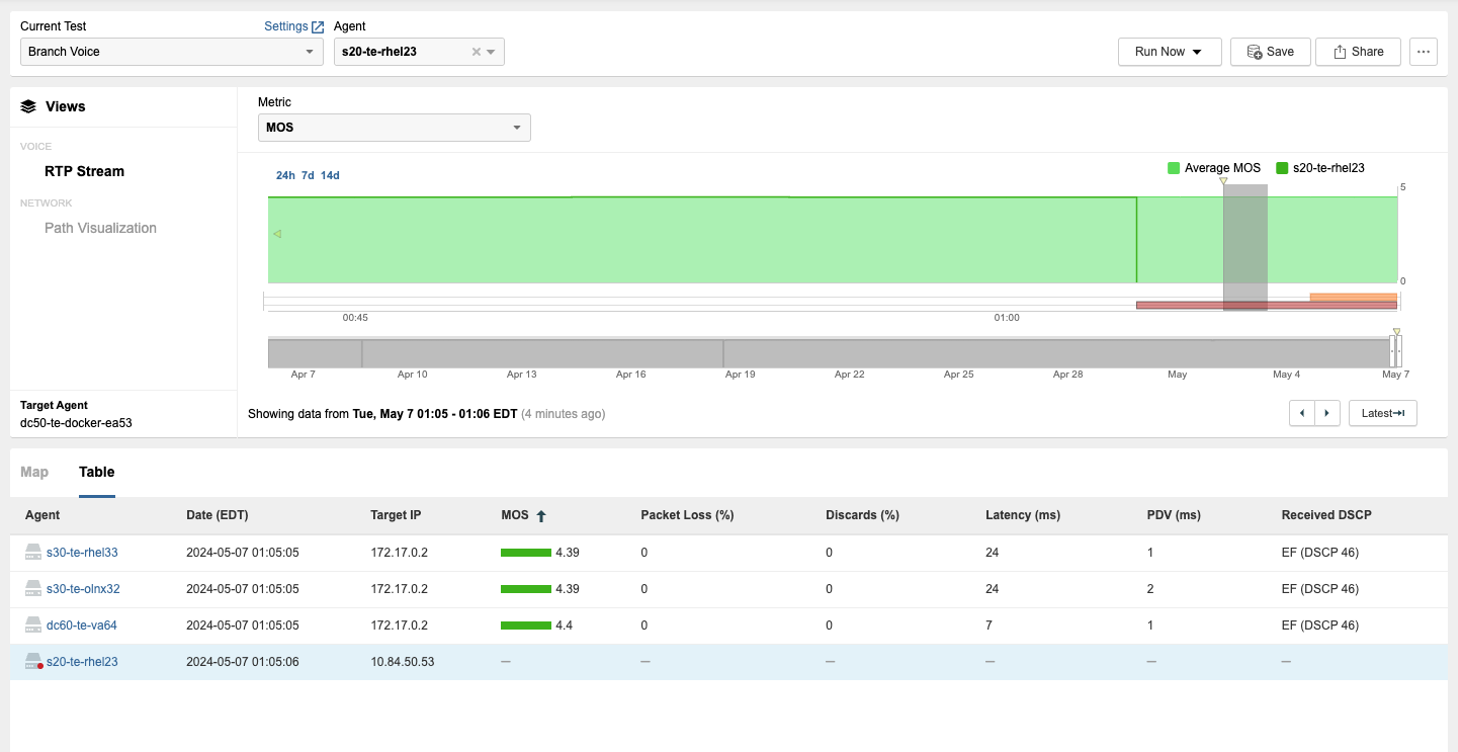
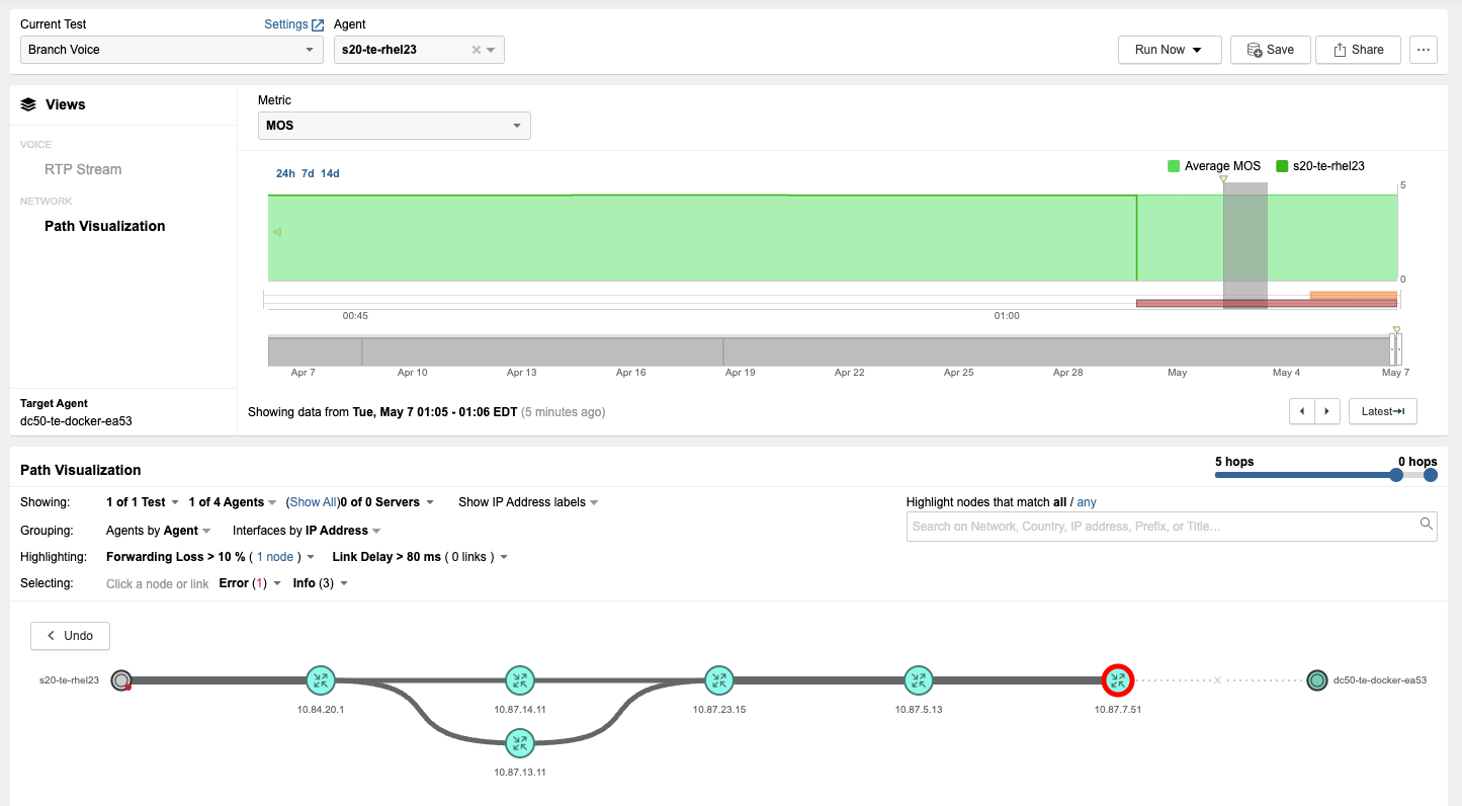
Users on remote sites are reporting voice issues, can you identify possible causes and next steps from the following exhibits?
- Select Question Types you want
- Set your Desired Pass Percentage
- Allocate Time (Hours : Minutes)
- Create Multiple Practice tests with Limited Questions
- Customer Support
Thomas Robinson
20 days agoRebecca Walker
1 month agoGary Lewis
2 months agoCharles Evans
2 months agoAngela Nguyen
3 months agoGerald Parker
3 months agoLinda Baker
4 months agoKenneth Green
4 months agoStephanie Miller
5 months agoCarol Turner
5 months agoAmanda Carter
6 months agoMatthew Parker
6 months agoCrystal Cooper
6 months agoMelissa Smith
5 months agoHarold Brown
5 months agoMonica Bell
5 months agoJestine
6 months agoLouvenia
7 months agoBarrie
7 months agoLeonardo
7 months agoBrinda
7 months agoVashti
8 months agoTwana
8 months agoAshleigh
8 months agoJules
9 months agoWillard
9 months agoChantell
9 months agoTruman
9 months agoArthur
9 months ago