Deal of The Day! Hurry Up, Grab the Special Discount - Save 25% - Ends In 00:00:00 Coupon code: SAVE25
Free Preparation Discussions
CIMAPRA17-BA1-1 Exam - Topic 1 Question 47 Discussion
Actual exam question for
CIMA's
CIMAPRA17-BA1-1 exam
Question #: 47
Topic #: 1
[All CIMAPRA17-BA1-1 Questions]
Topic #: 1
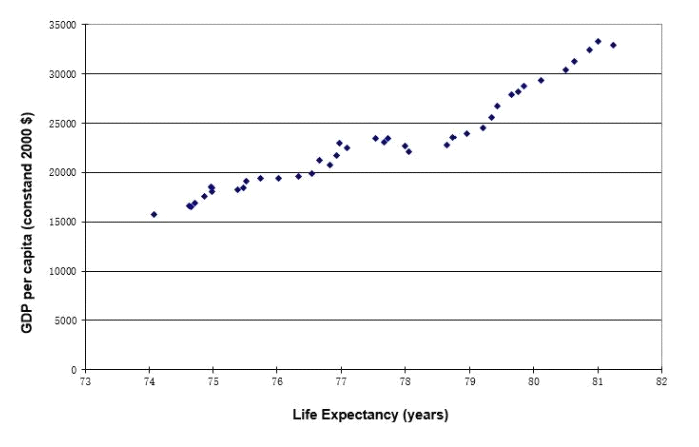
The following scatter diagram displays the total life expectancy in years on the X axis and GDP per capita (constant 2000 S) on the Y axis, in Country S for the past 40 years. Which of the following statements is true in respect of the graph?
Suggested Answer:
C
Willard
9 months agoVirgilio
9 months agoSue
9 months agoGlen
9 months agoJoana
9 months agoJacinta
10 months agoPedro
10 months agoLeslie
10 months agotachy_22
5 years ago