
Free Preparation Discussions
 MENU
MENU
Category Management Association Certified Professional Category Manager Exam Questions
- Topic 1: Data Competency and Category Health: This domain focuses on working with panel and POS data, measuring category performance, and identifying key drivers that impact category growth and health. It emphasizes turning data into actionable business insights.
- Topic 2: Assortment, Pricing, and Promotion Management: This area covers assortment planning, pricing strategies, and promotion analysis techniques. Candidates learn how to optimize product selection, pricing decisions, and promotional effectiveness to improve category results.
- Topic 3: Advanced Analytics and Store Insights: This topic focuses on advanced analytical methods, store clustering, and the use of geodemographic data to understand shopper behavior and support category decision-making.
- Topic 4: Retail Strategy and Category Execution: This domain covers fact-based selling, space management, retailer economics, and supply chain concepts. It emphasizes developing and executing category strategies that align with retailer objectives and business performance goals.
Free Category Management Association Certified Professional Category Manager Exam Actual Questions
Note: Premium Questions for Certified Professional Category Manager were last updated On Sep. 27, 2026 (see below)
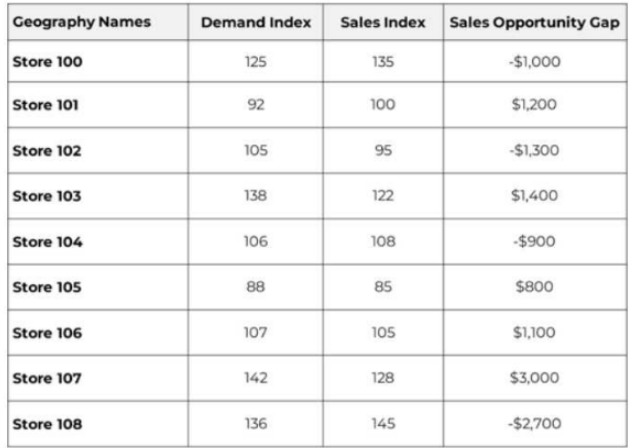
What stores would be included in a High Demand/High Opportunity Cluster?
The correct answer is D.
A High Demand/High Opportunity Cluster should include stores with a clearly high demand index and a positive sales opportunity gap. CMKG explains that store clustering should group stores with similar shoppers, performance, and traits, and that clusters should help retailers target unique local-market demands and manage stores based on opportunity.
Stores 103 and 107 are the only clean match. Store 103 has a Demand Index of 138 and a positive Sales Opportunity Gap of $1,400. Store 107 has a Demand Index of 142 and a positive Sales Opportunity Gap of $3,000. Both are materially above average demand and still have sales upside.
Stores 100 and 108 have high demand, but their opportunity gaps are negative, meaning they are not high-opportunity stores. Store 106 has a positive opportunity gap, but its Demand Index of 107 is only slightly above average and does not fit the ''high demand'' threshold implied by the answer choices. Store 101 has opportunity, but demand is below average at 92.
What does price elasticity measure in the context of pricing strategies?
The correct answer is D.
The CPCM pricing analytics course covers advanced analytic techniques used to assess retailer pricing, including price-setting rules and methods used to evaluate pricing decisions. Price elasticity is one of the core pricing analytics concepts because it measures how demand responds when price changes. Harvard Business Review defines price elasticity as showing how responsive customer demand is for a product based on its price.
Option D is the only answer that correctly describes price elasticity. It is about demand sensitivity to price changes.
Option A is wrong because product quality and satisfaction are consumer perception measures. Option B is seasonality analysis. Option C is advertising or promotion response analysis. None of those define price elasticity.
When showing the size of prize, what factors are good to keep in mind?
The correct answer is C.
The ''size of prize'' must be credible. In category management, it is not enough to show a large opportunity number just to impress the buyer. The opportunity should be reasonable, tied to facts, and supported by clear math. CMKG's fact-based presentation guidance specifically emphasizes defining the growth opportunity, quantifying the opportunity, identifying the strategy, and creating action with tactics. It also says presentations should include relevant insights derived from category data to support the idea.
Option A is wrong because hiding the math weakens trust. Option B is too broad because ''comprehensive analytics'' can become overwhelming if it is not focused. Option D is dangerous because inflating the opportunity just to get attention undermines credibility. A strong size-of-prize statement should make the buyer think: ''That number is realistic, the logic is clear, and the path to achieving it makes sense.''
What does the metric 'Household Penetration' measure in market-level shopper dynamics?
The correct answer is D.
Household penetration measures how many households bought the product, brand, category, or product group during the measured period. CMKG explains the panel-data formula as Total Number of Buying Households, or Penetration, multiplied by Spend per Buying Household equals Dollar Sales. It further explains that penetration relates to the number of households purchasing the product.
Option A describes purchase quantity or items per household, not penetration. Option B describes share of wallet or share of requirements-type spending allocation, not household penetration. Option C describes category dollar sales, not the breadth of the buyer base.
Household penetration is a reach measure. It tells whether the category is bought by many households or only by a narrow group of households.
The best Predictive Analytic tools use which of the following? Select the best answer.
The correct answer is A.
The CPCM course states that moving into advanced category analytics includes predictive analytics, specifically naming collaborative filtering, clustering algorithms, regression models, and time-to-event models. Those methods require historical data, statistical modeling, and machine-learning-style pattern recognition. IBM defines predictive analytics as predicting future outcomes by using historical data combined with statistical modeling, data mining techniques, and machine learning.
Option A is the most complete answer because predictive analytics needs all three: historical data to learn from, statistical models to quantify relationships, and machine learning to detect patterns and improve prediction. Option B omits machine learning. Option C omits statistical models. Option D omits historical data, which is the base input for predictive analytics.
- Select Question Types you want
- Set your Desired Pass Percentage
- Allocate Time (Hours : Minutes)
- Create Multiple Practice tests with Limited Questions
- Customer Support
Sonal Kumar
22 minutes agoAli Ahmed
2 days agoMagnus Bianchi
21 days agoSergei Esposito
1 month agoManon Popov
1 month agoNatasha Ivanov
2 months agoKavya Dubey
2 months agoMatthew Martin
2 months ago